Comparative Study
. 2006 Nov 8;26(45):11709-19.
doi: 10.1523/JNEUROSCI.3371-06.2006.

Glomerulus-specific, long-latency activity in the olfactory bulb granule cell network

Affiliations
Comparative Study

Glomerulus-specific, long-latency activity in the olfactory bulb granule cell network

Vikrant Kapoor et al. J Neurosci. .

Abstract

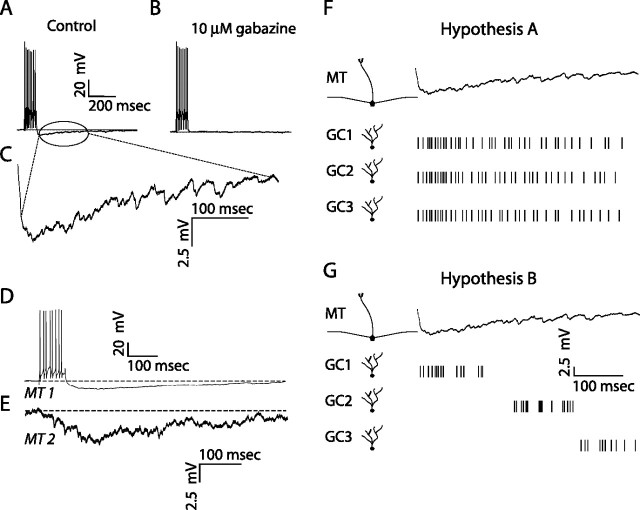
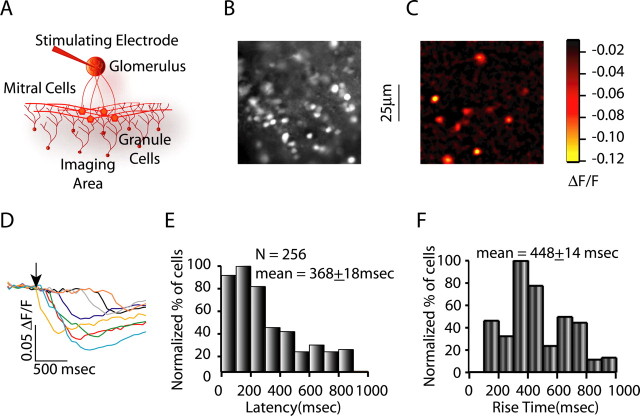
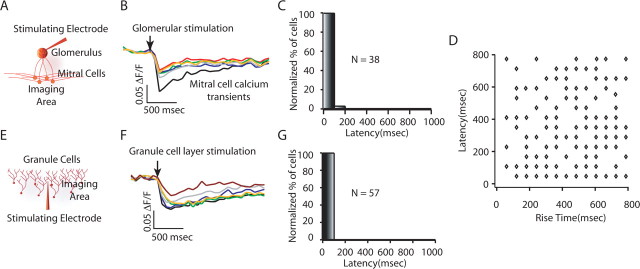
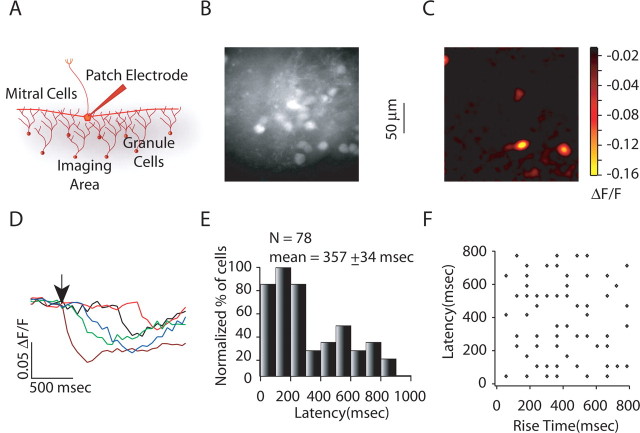
Reliable, stimulus-specific temporal patterns of action potentials have been proposed to encode information in many brain areas, perhaps most notably in the olfactory system. Analysis of such temporal coding has focused almost exclusively on excitatory neurons. Thus, the role of networks of inhibitory interneurons in establishing and maintaining this reliability is unclear. Here we use imaging of population activity in vitro to investigate the mechanisms of temporal pattern generation in mouse olfactory bulb inhibitory interneurons. We show that activity of these interneurons evolves slowly in time but that individual neurons fire at reliable times, with a timescale similar to the slow changes in the patterns of odor-evoked activity and to odor discrimination. Most strikingly, the latency of a single granule cell is highly reliable from trial to trial during repeated stimulation of the same glomerulus, whereas this same cell will have a markedly different latency when a different glomerulus is activated. These data suggest that the timing of granule cell-mediated inhibition in the olfactory bulb is tightly regulated by the source of input and that inhibition may contribute to the generation of reliable temporal patterns of mitral cell activity.


Figures

Figure 1.
Figure 1.
Kinetics of recurrent and lateral IPSPs. A, Mitral cell voltage trace in response to current injection (300 pA for 100 ms) showing a series of spikes, followed by long-lasting recurrent inhibition. B, Same mitral cell voltage response to current injection after the addition of 10 μm gabazine to the bath. C, Enlarged view of mitral cell voltage trace showing the presence of many high-frequency inhibitory synaptic events. D, E, Mitral cell (MT) voltage traces for two mitral cells (bottom trace is an average), in response to current injection (400 pA for 100 ms) in cell 1, showing the time course of inhibition (lateral) in the second cell. F, G, Hypotheses to explain the duration of recurrent and lateral IPSPs. F, Hypothesis A: single granule cells are persistently active. After a single stimulus, individual granule cells maintain activity with a time course comparable with that of recurrent (or lateral) inhibition. G, Hypothesis B: granule cell latencies are widely distributed. Different granule cells have different activation latencies that are randomly distributed along the time course of dendrodendritic (recurrent/lateral) inhibition.
Figure 2.
Figure 2.
Response latencies and durations of granule cell activity for glomerular stimulation. A, Experimental setup for recording granule cell calcium transients in response to glomerular stimulation. B, C, Raw fluorescence and glomerular stimulation-evoked activity in the granule cells, respectively. D, Granule cell calcium transients for cells shown in C in response to glomerular stimulation. The arrow depicts the time of stimulation. E, Granule cell activation latency histogram for glomerular stimulation (average latency, 368 ± 18 ms; n = 256), showing widely distributed activation latencies. F, Granule cell rise time histograms for glomerular stimulation (average, 448 ± 14 ms), showing widespread distribution of granule cell rise times.
Figure 3.
Figure 3.
Possible sources of long-latency granule cell spiking. A, Experimental setup for imaging mitral cell activity in response to glomerular stimulation. B, C, Mitral cell calcium transients (B) and mitral cell response latency histogram in response to glomerular stimulation (C), showing near simultaneous activation of mitral cells. The arrow depicts the time of glomerular stimulation. D, Plot of granule cell response latencies versus granule cell rise time for glomerular stimulation. There was no correlation between granule cell activation latencies and granule cells rise times (r = 0.13). E, Experimental setup for imaging granule cell activity in response to extracellular stimulation in the granule cell layer. F, G, Granule cell calcium transients (F) and granule cell response latency histogram in response to granule cell layer stimulation (G), showing low variability in the granule cell responses.
Figure 4.
Figure 4.
Response latencies and duration of granule cell activity for single mitral cell stimulation. A, Experimental setup for imaging granule cell activity in response to single mitral cell stimulation. B, C, Raw fluorescence and ΔF/F image showing single mitral cell stimulation-evoked activity, respectively. D, Granule cell calcium transients for cells shown in C. The arrow depicts the time of stimulation. E, Granule cell activation latency histogram for glomerular stimulation (average latency, 357 ± 34 ms; n = 78), showing widely distributed activation latencies. F, Plot of granule cell response latencies versus granule cell rise time for glomerular stimulation. There was no correlation between granule cells activation latencies and granule cells rise time (r = 0.22).
Figure 5.
Figure 5.
Blockade of transient potassium channels alter granule cell latencies. A, Granule cell activation latency distributions: red, normal conditions (average latency, 368 ± 18 ms; n = 256); blue, 2.5 mm 4-AP (average, 310 ± 17 ms; n = 242); brown, 5.0 mm 4-AP (average, 213 ± 20 ms; n = 108); green, 10.0 mm 4-AP (average, 182 ± 16 ms; n = 149), showing shift in granule cell activation latency distribution after blocking IA. Curves have been normalized to the peak of the curves. B, Granule cell activation latency distributions for conditions described in A. Curves have been normalized to the area under curves. C, Plot for average rise times and average latencies under different concentrations of 4-AP showing no significant difference in the total rise time of granule cell calcium transients under different conditions (mean rise time was 448 ± 14 ms for normal condition, 423 ± 15 ms for 2.5 mm 4-AP, 452 ± 22 ms for 5 mm 4-AP, and 456 ± 19 for 10 mm 4-AP) (p > 0.1 for Wilcoxon's rank sum test). D, Experimental setup for measuring decay time constant of granule cell-mediated inhibition. E1, E2, 4-AP resulted in faster granule cell-mediated inhibition and reduced the time-to-peak of inhibition. The arrow depicts the stimulation time. E3, 4-AP reduced the decay time constant of granule cell-mediated inhibition. QX-314, 2(Triethylamino)-N-(2,6-dimethylphenyl) acetamine.
Figure 6.
Figure 6.
Granule cell activation has low probability but high reliability. A1, B1, Averages of ΔF/F map for 10 trials each for granule cell population activity in response to glomerular stimulation under normal conditions (A1) and 10 mm 4-AP (B1), showing low probability of granule cell activation for glomerular stimulation. A2, B2, Calcium transients for four successive trials for five of the cells shown in A1, under normal conditions (A2) and for 10 mm 4-AP (B2). The probability of granule cell activation is low but activation latencies are reliable trial to trial. B3. Blocking of A-current by 4-AP increases the reliability of granule cells. C, Plot showing the reliability in granule cell latencies (24 randomly chosen cells to depict the entire range of activation latencies). D, Current recordings (5 selected) from a mitral cell (voltage clamped at −40 mV) in response to glomerular stimulation showing IPSCs with same latencies across trials. E, Histogram showing pairwise correlation for 50 consecutive current recordings from a mitral cell (solid line) and the same for 50 simulated trials (dotted line), showing higher correlation for IPSCs across trials than expected by chance. F, Plot showing higher average correlation for IPSCs recorded in five different mitral cells than the simulated trials.
Figure 7.
Figure 7.
Glomerulus specificity of granule cell activation latencies. A, Experimental setup showing stimulation of two glomeruli that activates overlapping populations of granule cells. B, C, Activity evoked by first (red) and second (green) glomerular stimulation, respectively. D, Overlay of B and C, showing the overlap in activity evoked by two glomeruli. Yellow cells are activated by both the glomeruli. E, Calcium transients from a single granule cell active in D. Traces show calcium transients in response to stimuli of one glomerulus (red) and the other glomerulus (green). Note that latencies of same-colored traces are the same but different for transients elicited by stimulation of different glomeruli. F, Plot showing the latencies for the overlapping set of granule cells (as the yellow cells in D above; n = 68), for two stimuli of the same (shown in red and green triangles) and for two different glomeruli (shown in yellow circles). G, Projections of trial vectors (vectors containing the latency information of granule cells) onto the ideal response vectors for two glomeruli ([vector]G1l and [vector]G2l), showing glomerulus-specific clustering of trials. H, Projections of trial vectors (vectors contains information only about the activity state of granule cells) on the ideal response vectors for two glomeruli ([vector]G1r and [vector]G1r).
Figure 8.
Figure 8.
Granule cell activity is uncorrelated. A1, Raw fluorescence image of fura-2-loaded olfactory bulb slice. A2, Union of 10 successive trials of granule cell population activity in response to glomerular stimulation, showing a total of 24 granule cells active during these trials. B1, B2, Correlation matrices for activity of cells shown in A2. B1, Actual data show the probability (of ≥10 trials) of each of the 24 granule cells firing on a given sweep (diagonal) and the probability of pairs of cells being both activated (nondiagonal elements). B2, Like B1, except that the values give the correlation predicted by chance, assuming cells are active independently. Similarity between B1 and B2 indicates that cells are actually independent, i.e., that activity across a population of granule cells is uncorrelated. B3, Summary plot showing strong correlation between predicted coactivation probability (as B2) and actual coactivation probability (as in B1).

References

    1. Abraham NM, Spors H, Carleton A, Margrie TW, Kuner T, Schaefer AT. Maintaining accuracy at the expense of speed: stimulus similarity defines odor discrimination time in mice. Neuron. 2004;44:865–876. - PubMed
    1. Balu R, Larimer P, Strowbridge BW. Phasic stimuli evoke precisely timed spikes in intermittently discharging mitral cells. J Neurophysiol. 2004;92:743–753. - PubMed
    1. Barish ME. Differentiation of voltage-gated potassium current and modulation of excitability in cultured amphibian spinal neurones. J Physiol (Lond) 1986;375:229–250. - PMC - PubMed
    1. Chen WR, Xiong W, Shepherd GM. Analysis of relations between NMDA receptors and GABA release at olfactory bulb reciprocal synapses. Neuron. 2000;25:625–633. - PubMed
    1. Egger V, Svoboda K, Mainen ZF. Mechanisms of lateral inhibition in the olfactory bulb: efficiency and modulation of spike-evoked calcium influx into granule cells. J Neurosci. 2003;23:7551–7558. - PMC - PubMed

Publication types

MeSH terms