Comparative Study
. 2006 Nov 8;26(45):11720-5.
doi: 10.1523/JNEUROSCI.2887-06.2006.

GABAergic input onto CA3 hippocampal interneurons remains shunting throughout development

Affiliations
Comparative Study

GABAergic input onto CA3 hippocampal interneurons remains shunting throughout development

Tue G Banke et al. J Neurosci. .

Abstract

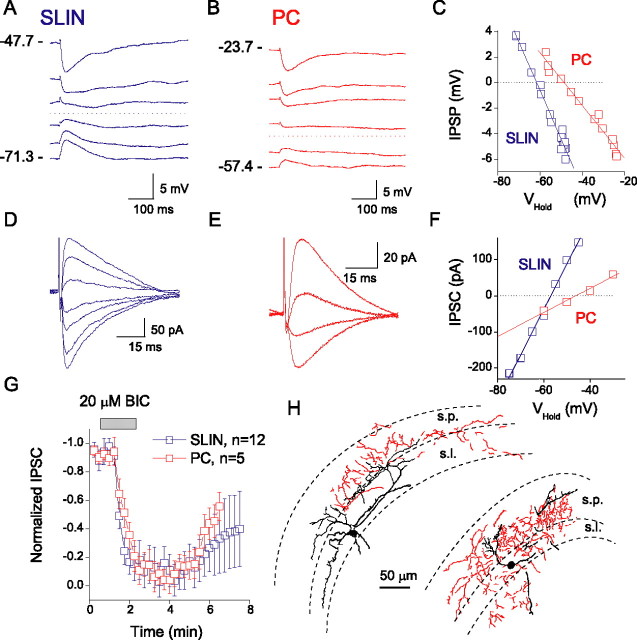
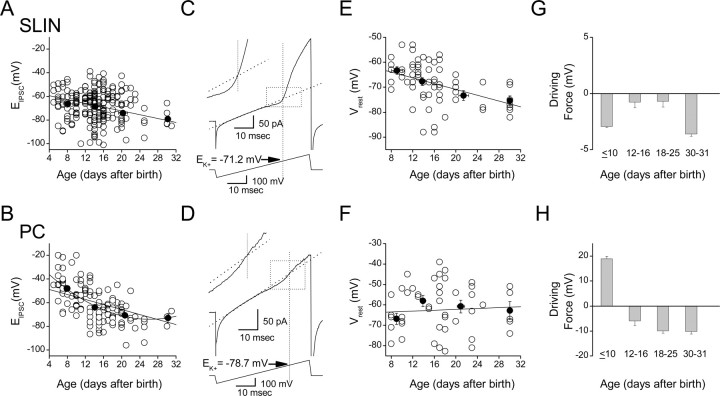
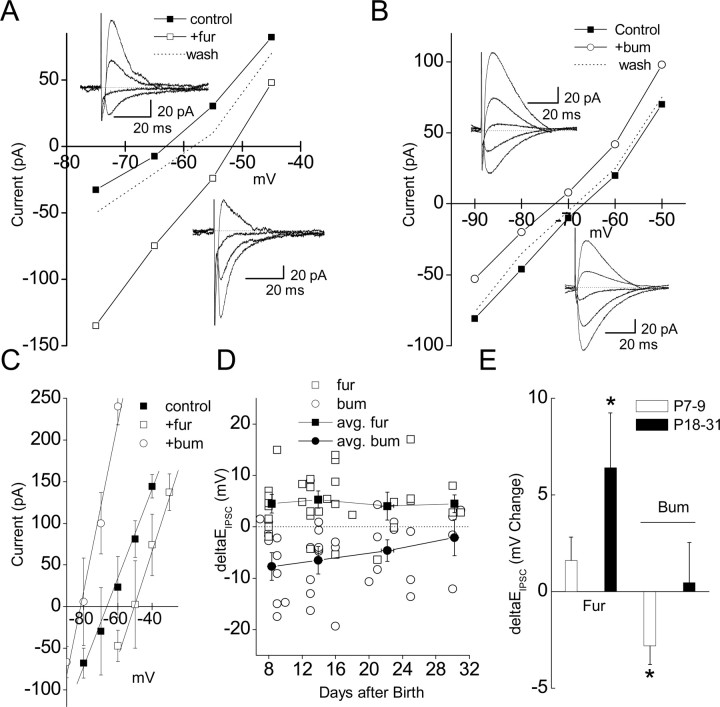
In hippocampus, the net flow of excitability is controlled by inhibitory input provided by the many populations of local circuit inhibitory interneurons. In principal cells, GABA(A) receptor-mediated synaptic input undergoes a highly coordinated shift from depolarizing early in life to a more conventional hyperpolarizing inhibition on maturation. This switch in inhibitory input polarity is controlled by the developmental regulation of two chloride cotransporters (NKCC1 and KCC2) that results in a net shift from high to low intracellular Cl(-). Whether inhibitory input onto inhibitory interneurons demonstrates a similar developmental shift in intracellular Cl(-) is unexplored. Using the gramicidin perforated-patch configuration, we recorded from CA3 hippocampal stratum lucidum interneurons and pyramidal cells to monitor inhibitory input across a broad developmental range. GABA(A) receptor-mediated synaptic input onto stratum lucidum inhibitory interneurons was shunting in nature across the entire developmental age range tested, as resting membrane potential and the IPSC reversal potential remained within a few millivolts (1-4 mV) between postnatal day 5 (P5) and P31. Furthermore, sensitivity to block of the two chloride cotransporters KCC2 and NKCC1 did not differ across the same age range, suggesting that their relative expression is fixed across development. In contrast, pyramidal cell synaptic inhibition demonstrated the well described switch from depolarizing to hyperpolarizing over the same age range. Thus, in contrast to principal cells, inhibitory synaptic input onto CA3 interneurons remains shunting throughout development.


Figures

Figure 1.
Figure 1.
Inhibitory synaptic events evoked onto SLINs and CA3 pyramidal cells. Perforated-patch recordings of representative IPSPs (A, B) and IPSCs (D, E) evoked onto an SLIN (P12) (A, D) and a CA3 pyramidal cell (P12) (B, E). Respective voltage and current–voltage relationships are plotted to the right (C, F). G, IPSCs (Vhold= −60 mV) were blocked by 20 μm bicuculline. Error bars indicate SEM. H, Morphological profiles of two representative SLINs, biocytin-filled and reconstructed using Neurolucida. All cells had soma and dendrites principally located within stratum lucidum, pyramidale, and radiatum. The axons (shown in red) primarily ramified throughout stratum lucidum and radiatum and into the stratum pyramidal cell layer. s.p., Stratum pyramidale; s.l., stratum lucidum.
Figure 2.
Figure 2.
Shunting inhibition onto SLINs persists throughout development. A, B, Evoked IPSC reversal potential (EIPSC) for SLINs (A) and PCs (B) measured across different developmental stages. Each open symbol represents the EIPSC obtained from a single recording. Averaged data (black-filled symbols) for each development stage (≤10, 12–16, 18–25, and 30–31) are superimposed on top, and linear fit through averaged data is shown. A second-order polynomial fit to averaged PC data (B) gave a better fit. Spearman rank correlation coefficients were −0.66 and −0.38 for SLINs vs age and for PC vs age, respectively. C, D, Examples of cell-attached recordings from an interneuron (C) and pyramidal neuron (D), respectively, used to measure Vrest. A linear regression fit to the linear phase (typically fitted between the period 10–25 ms of the ramp) is superimposed (dotted lines). The bottom traces indicate the corresponding voltage ramp protocol (ramp from −100 to+200 mV). The intersection of the vertical dotted line with the linear fit indicates EK+ (i.e., the estimated resting potential for this cell), which for the interneuron was −71.2 mV (P17) and for PC (P18) was −78.7 mV, respectively. The inset for each panel shows this period of the ramp in greater detail. E, F, The resting membrane potential of SLINs and PCs across development measured using cell-attached recording configuration. At different development stages (postnatal days ≤10, 12–16, 18–25, and 30–31), the average Vrest was calculated and superimposed on data and fit with linear regression. G, H, Calculation of the GABAergic synaptic driving force (EIPSCVrest) at the resting membrane potential for both SLINs (G) and PCs (H). Note that inhibitory events in SLINs have a minimal driving force at all developmental ages tested, suggesting that inhibition is primarily “shunting.” This is in marked contrast to PCs, which show a clear polarity shift in driving force after day 10. Error bars indicate SEM.
Figure 3.
Figure 3.
Developmental profile of EIPSC sensitivity to furosemide and bumetanide. A, B, Representative IV plot obtained from an SLIN before and after application of 100 μm furosemide (A) or 20 μm bumetanide (B). Application of furosemide shifted EIPSC from −62.3 to −52.2 mV. Application of bumetanide shifted EIPSC from −66.7 to −72.0 mV. A, Inset, Example traces in control and in the presence of furosemide, respectively. B, Inset, Example traces in the presence of bumetamide and in control, respectively. C, Average change in IV for SLIN in control (black squares; EIPSC= −65.6 ± 3.8 mV), in the presence of bumetanide (open circles; EIPSC= −81.9 ± 4.1 mV), or in the presence of furosemide (open squares; EIPSC= −51.6 ± 2.6 mV); from slices from P14–P17 mice, n= 5–7. D, Plot of absolute change in EIPSC induced by bumetanide or furosemide (open symbols reflect individual experiments). Values <0 and >0 mV correspond to hyperpolarizing and depolarizing shifts in EIPSC, respectively. At different development stages (≤10, 12–16, 18–25, and 30–31), the average change in EIPSC was superimposed on the data (black-filled circles). E, Furosemide and bumetanide was tested on PCs from young mice (P7–P9) or older mice (P18–P31). Values <0 and >0 mV correspond to a hyperpolarizing and depolarizing shift in the EIPSC, respectively. Note that, in pyramidal cells, the effect of furosemide on EIPSC was significant (p= 0.029) only in older animals, whereas bumetanide only hyperpolarized EIPSC in young animals (p= 0.034), consistent with the known developmental expression of KCC2 and NKCC1, respectively. Error bars indicate SEM. Asterisks indicate p < 0.05.

Similar articles

Cited by

References

    1. Bartos M, Vida I, Frotscher M, Meyer A, Monyer H, Geiger JRP, Jonas P. Fast synaptic inhibition promotes synchronized gamma oscillations in hippocampal interneuron networks. Proc Natl Acad Sci USA. 2002;99:13222–13227. - PMC - PubMed
    1. Ben-Ari Y. Excitatory actions of GABA during development: the nature of the nuture. Nat Rev Neurosci. 2002;3:728–739. - PubMed
    1. Ben-Ari Y, Cherubini E, Corradetti R, Gaiarsa J. Giant synaptic potentials in immature rat CA3 hippocampal neurones. J Physiol (Lond) 1989;416:303–325. - PMC - PubMed
    1. Chavas J, Marty A. Coexistence of excitatory and inhibitory GABA synapses in the cerebellar interneuron network. J Neurosci. 2003;23:2019–2031. - PMC - PubMed
    1. Chudotvorova I, Ivanov A, Rama S, Hubner CA, Pellegrino C, Ben-Ari Y, Medina I. Early expression of KCC2 in rat hippocampal cultures augments expression of functional GABA synapses. J Physiol (Lond) 2005;566:671–679. - PMC - PubMed

Publication types

MeSH terms