Comparative Study
. 2006 Nov 8;26(45):11726-42.
doi: 10.1523/JNEUROSCI.3420-06.2006.

Directional signals in the prefrontal cortex and in area MT during a working memory for visual motion task

Affiliations
Comparative Study

Directional signals in the prefrontal cortex and in area MT during a working memory for visual motion task

Daniel Zaksas et al. J Neurosci. .

Abstract

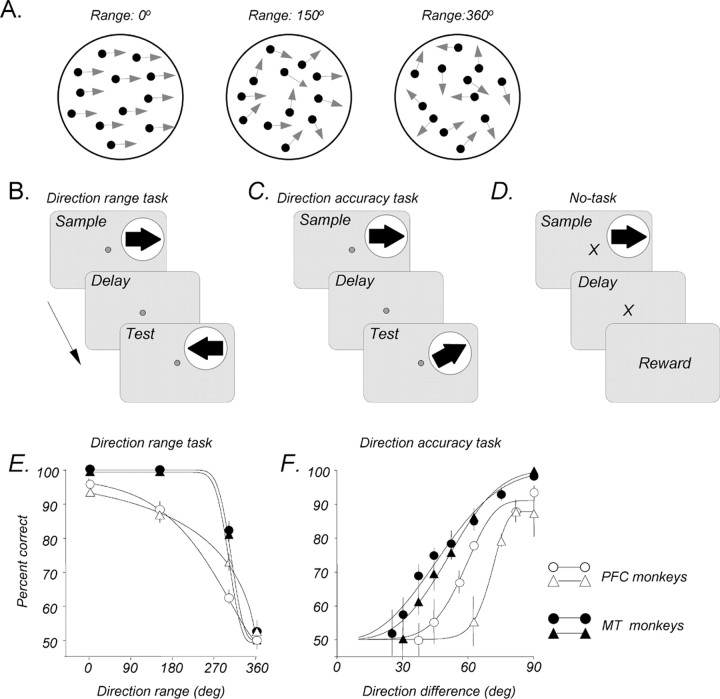
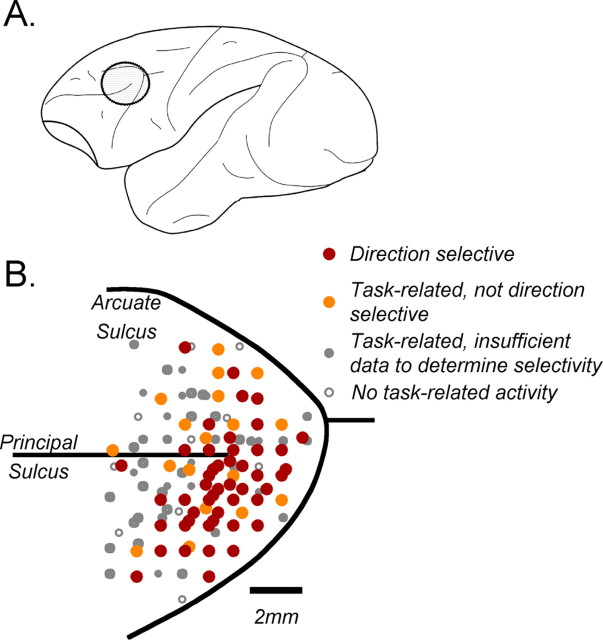
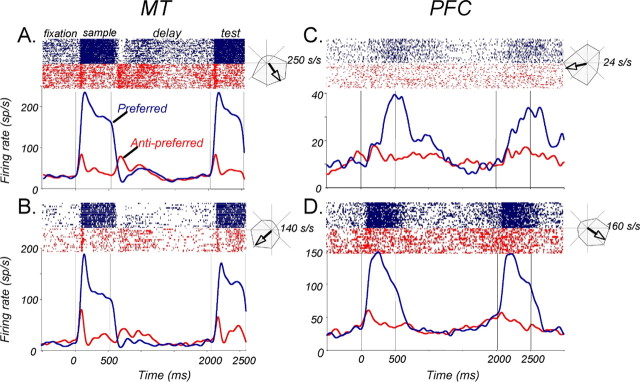
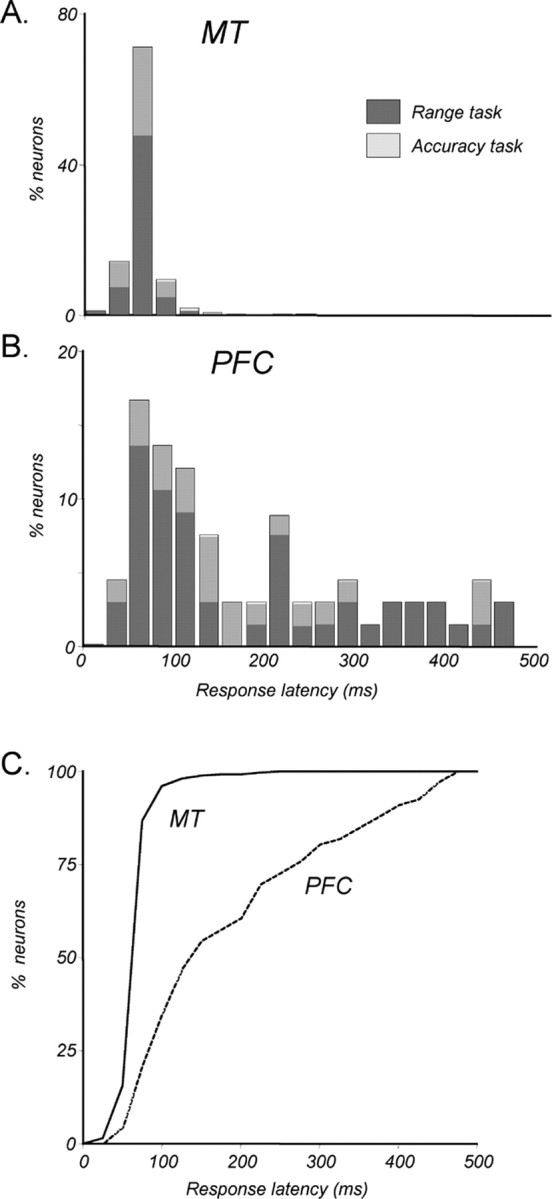
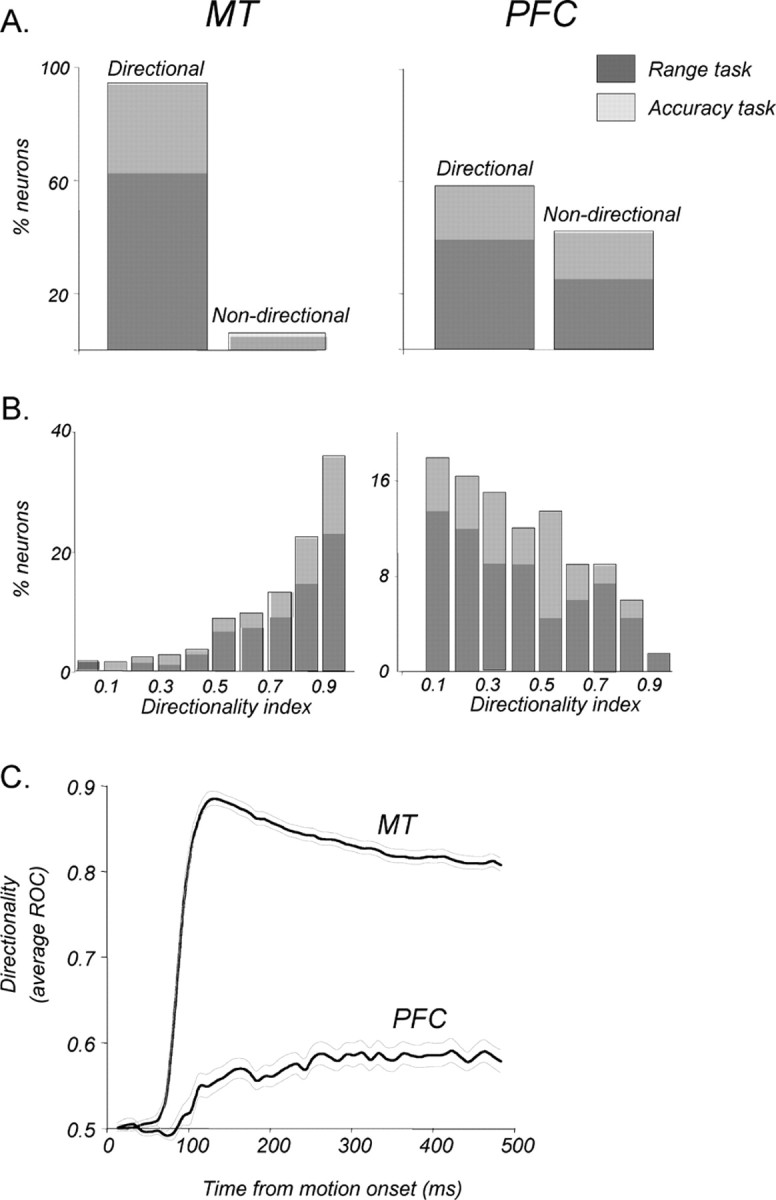
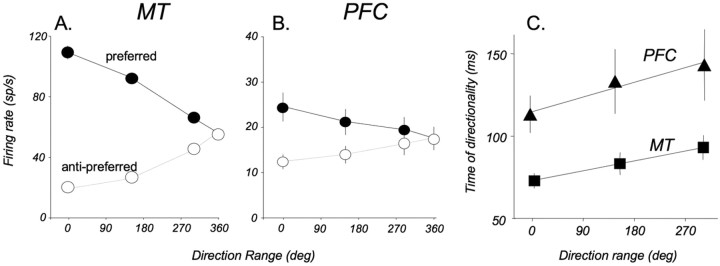
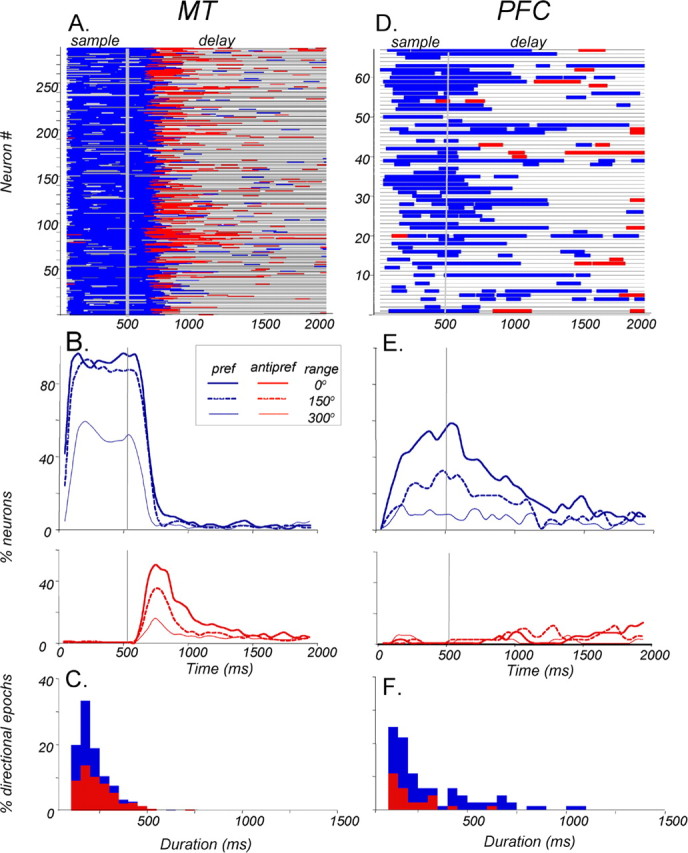
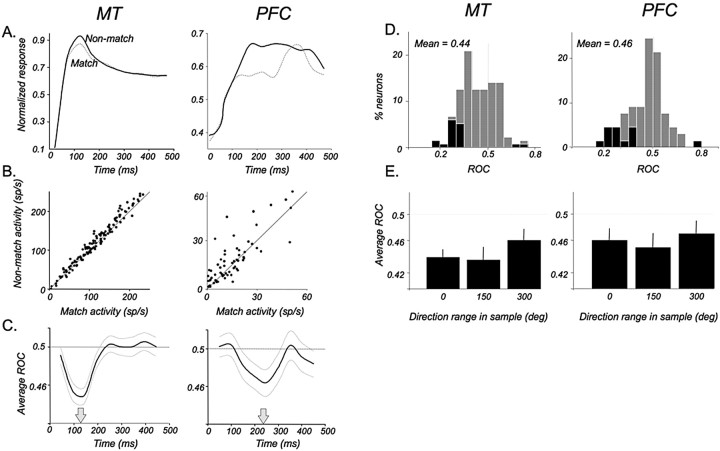
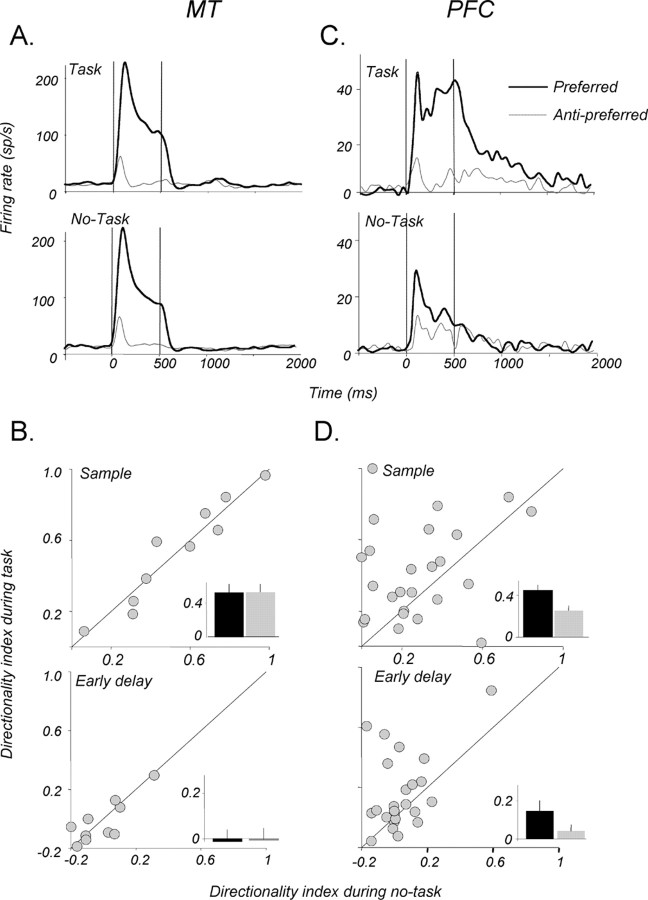
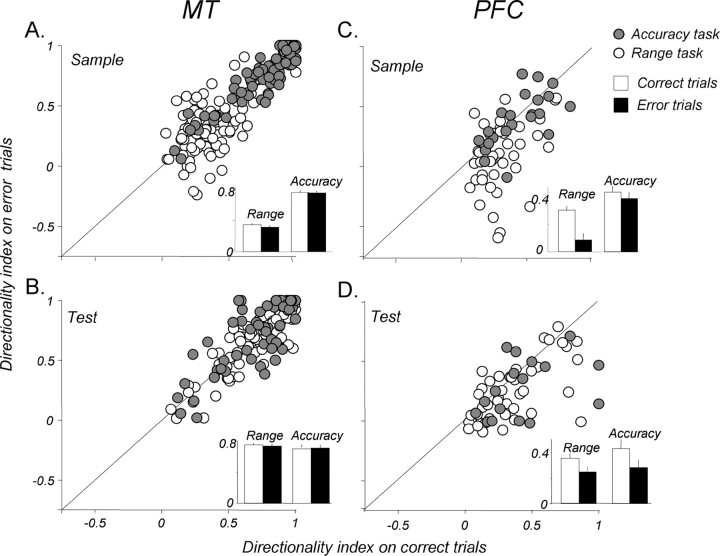
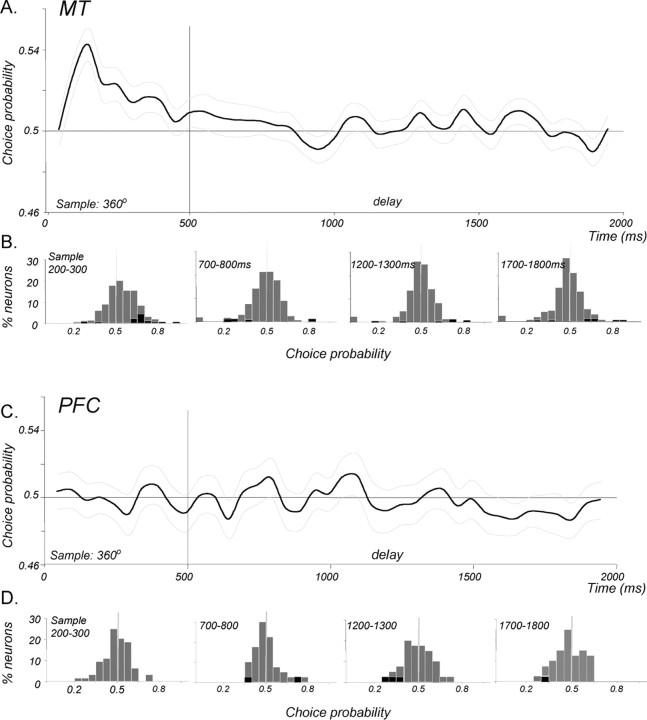
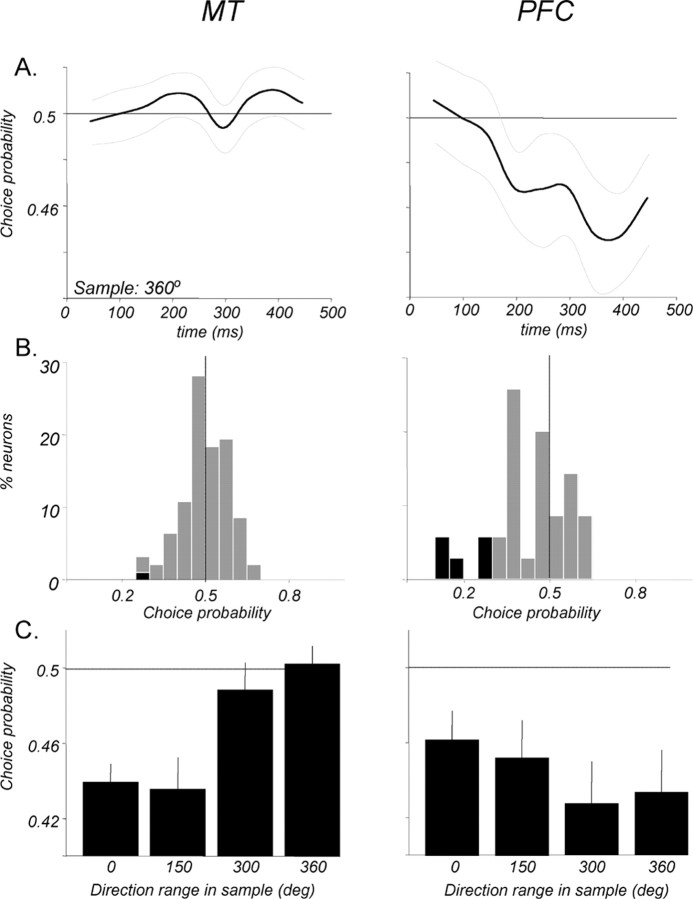
Neurons in the middle temporal visual area (MT) have been implicated in the perception of visual motion, whereas prefrontal cortex (PFC) neurons have been linked to temporary storage of sensory signals, attentional and executive control of behavior. Using a task that placed demands on both sets of neurons, we investigated their contribution to working memory for visual motion. Monkeys compared the direction of two moving random-dot stimuli, sample and test, separated by a brief memory delay. Neurons in both areas showed robust direction-selective activity during all phases of the task. During the sample, approximately 60% of task-related PFC neurons were direction selective, and this selectivity emerged 40 ms later than in MT. Unlike MT, the PFC responses to sample did not correlate with behavioral choices, but their selectivity was modulated by task demands and diminished on error trials. Reliable directional signals were found in both areas during the memory delay, but these signals were transient rather than sustained by neurons of either area. Responses to the test in both areas were modulated by the remembered sample direction, decreasing when the test direction matched the sample. This decrease arose in the PFC 100 ms later than in MT and was predictive of the forthcoming decision. Our data suggest that neurons in the two regions are functionally connected and make unique contributions to different task components. PFC neurons reflect task-related information about visual motion and represent decisions that may be based, in part, on the comparison in MT between the remembered sample and test.


Figures

Figure 1.
Figure 1.
Visual stimuli, behavioral tasks, and discrimination performance. A, Random-dot stimuli. The stimuli consisted of random dots displaced in directions chosen from a predetermined distribution. The width of this distribution determined the range of directions within which individual dots move and was varied between 0° (all dots moving in the same direction) and 360° (dots moving in all directions). B, Direction range task. During this task, sample and test stimuli, separated by a 1500 ms delay, moved either in the same or in opposite directions. Monkeys were required to fixate a small spot at the center of the display throughout the trial and pressed the right or the left button to report whether the directions of the two stimuli were the same or different. During each recording session, the direction range in the sample was varied, whereas the test always contained coherent motion (0° range). C, Direction accuracy task. During this task, the random-dot stimuli presented as the sample or the test always moved coherently, and the difference in direction between sample and test was varied. D, No-task condition. During each trial, a coherent stimulus, followed by a 1500 ms delay, and a reward were presented while the monkey maintained fixation on a cross-shaped stimulus. No button press was required of the animal. E, Direction range task. Average psychometric functions for the two monkeys participating in MT recording sessions (filled symbols) and for the two monkeys participating in the PFC recording sessions (open symbols) are shown. The data were fitted with a Weibull function. Error bars indicate ±1 SEM. The data for each monkey were collected during 5–10 behavioral sessions, each consisting of 250–400 trials, and the points were fitted with a Weibull function. F, Direction accuracy task. Average psychometric functions for the MT and PFC monkeys relating performance to the angle of difference between sample and test directions are shown. The data were collected during 5–10 sessions, each consisting of 120–300 trials. Other details are as in E.
Figure 2.
Figure 2.
Locations of PFC recordings. A, Diagram of macaque cortex showing the location of recording chambers over the PFC. B, A magnified image of the region in A, showing locations of electrode penetrations and the properties of recorded neurons. Penetrations were made in four hemispheres (2 monkeys), and their maps were overlaid in the diagram. Each point is coded in accordance with the most experimentally relevant level of response found at the site. Therefore, any sites labeled as direction selective may have also contained neurons of any other response type. By extension, any sites labeled with filled symbols may have also contained neurons with no task-related activity.
Figure 3.
Figure 3.
Activity of example neurons during the tasks. Timing of sample and test presentation is indicated by the black bars along the timeline and vertical lines indicating onset and offset. Only trials with coherent sample (0° direction range) are shown. Rasters and spike density functions (1 ms step, 30 ms Gaussian envelope) are color-coded with respect to preferred (blue) and anti-preferred (red) directions. Polar plots to the right of each activity plot show the direction tuning of the neuron (response to motion in 8 directions) and the calculated vector (arrow) indicating the preferred direction. A, Direction-selective MT neuron during the direction range task. Note the typical short response latency and early directionality during the delay. B, MT neuron during the direction accuracy task. C, Direction-selective neuron in the PFC during the direction accuracy task. Note the late maximal response to the sample and somewhat higher activity throughout much of the delay after the preferred sample. D, Direction-selective neuron in the PFC during the direction accuracy task. Note the rapid onset and strong selectivity of responses during visual stimulation and an apparent absence of direction-selective activity during the delay. sp/s and s/s, Spikes per second.
Figure 4.
Figure 4.
Response latencies. A, Distribution of response latencies in MT to sample onset (n = 256). Latency is defined as the time at which the response to a preferred sample exceeded baseline (measured during 200 ms before onset) by at least 2 SDs. Proportions are shown separately for neurons recorded during direction range (dark gray) and direction accuracy (light gray) tasks. The distributions for the two tasks are not significantly different (p > 0.3, unpaired t test). B, Distribution of response latencies in the PFC (n = 66). Details are as in A. C, Recruitment of MT and PFC neurons during sample presentation. A cumulative proportion of neurons in each area that respond by a given time in the sample is shown. By ∼60 ms after sample onset, one-half of the recorded MT neurons began responding. In contrast, it took ∼140 ms for one-half of the recorded PFC neurons to begin responding.
Figure 5.
Figure 5.
Direction selectivity in MT and in the PFC. A, Proportions of direction-selective neurons among those recorded in MT and in PFC areas. Ninety-four percent (288 of 305) of all recorded MT neurons and 58% (67 of 115) of PFC neurons with task-related activity were direction selective (see Materials and Methods). Relative contributions to these proportions by neurons recorded during the direction range (dark gray) and direction accuracy (light gray) tasks are shown for each area. B, Distributions of maximal DIs showing the magnitude of selectivity for neurons in each area (MT, n = 288; PFC, n = 67). Neurons recorded during the two tasks are shown as in A. C, Emergence and reliability of the directional signals in each area expressed through ROC analysis. Directional signals in MT were substantially more reliable and occurred significantly earlier than in the PFC (p < 0.001, bootstrap hypothesis test; see Materials and Methods for details). The thin gray curves indicate ±1 SD.
Figure 6.
Figure 6.
Effect of direction range on responses in direction-selective neurons in MT and in the PFC. A, MT neurons. The firing rate of each neuron was calculated for all range values during a 100 ms window at the time of its maximal direction selectivity. Coherence strongly modulates responses to both preferred and anti-preferred motion. n = 186. B, PFC neurons. Note a similar pattern of modulation by direction range to that in MT. n = 40. C, Emergence of directionality as a function of direction range. The latencies for each range level were computed from an average ROC index for the population of all direction-selective neurons in each area (see Fig. 5C) as the time at which the ROC index significantly deviated from 0.5. Linear fits of the data recorded in MT (y = 0.07x + 73) and in the PFC (y = 0.1x + 115) indicate that delays in the emergence of directionality increase in both areas at a very similar rate as a function of decreasing stimulus coherence. sp/s, Spikes per second.
Figure 7.
Figure 7.
Directional signals in the PFC and MT during the memory delay. ROC analysis was applied to the sample and delay activity of each neuron (100 ms window, 10 ms step). A, Time course of directional signals in individual MT neurons (n = 288). Each horizontal line is the timeline of a single neuron through the sample and delay periods. Blue segments indicate times at which activity associated with a preferred sample was reliably higher than that associated with an anti-preferred sample. Red segments indicate the opposite relationship, whereas gray shows the times at which the signal was not significantly indicative of sample direction. Note that reliable direction selectivity seen during the sample generally disappears ∼200–250 ms into the delay and is often replaced by an anti-preferred-dominated signal. In the last third of the delay, directional activity is rare regardless of sign. B, The incidence of MT neurons with significant directional signals dominated by the preferred (pref; blue, top) and anti-preferred (antipref; red, bottom) directions, as a function of time in the sample and delay. Interrupted curves show the incidence for trials with a higher direction range (150 and 300° ranges). As expected from the data in Fig. 6A, directionality is less common at higher range levels. C, Distribution of durations of significant directional periods in MT occurring during the delay activity for preferred-dominated (blue) and anti-preferred-dominated (red) signals. Note that the anti-preferred signals were, on average, significantly longer than the preferred signals (p < 0.001, unpaired t test). D, Time course of directional signals in individual PFC neurons (n = 67). The pattern here also shows a high degree of transience in the signals but differs from that in A, because the directional signals in the delay are dominated by the preferred direction. Signals driven by the anti-preferred direction are relatively uncommon. E, The incidence of PFC neurons with significant directional signals. Preferred-dominated directional signals are less common at higher range levels, both during the sample and most of the delay. Overall, directional signals during the latter half of the delay are more common in the PFC than they are in MT. F, In the PFC, the preferred direction-dominated signals lasted longer than those dominated by the anti-preferred signals (p < 0.05, unpaired t test).
Figure 8.
Figure 8.
Modulation of test responses by sample direction. A, Average normalized responses to the test in MT (n = 169) and the PFC (n = 60) shown for trials in which the preferred test was a match (dotted line) or a non-match (solid line) to the preceding sample. B, Comparison of firing rates of individual neurons contributing to the averages in A to the preferred test during match and non-match trials. Rates were calculated for a 100 ms window centered on the time when the match suppression was most reliable (130 and 230 ms after test onset for MT and the PFC, respectively). C, Average reliability of the differences in responses during the test that matched and did not match the sample, computed by ROC analysis. ROC values <0.5 indicate lower firing rates during the matching test. In both areas, the effect is transient. However, it appears in MT 100 ms earlier than in the PFC. Thin gray curves indicate ±1 SEM. The mean of each distribution is indicated by an arrow. D, Distributions of ROC values for individual neurons at the time of maximal effect (MT, 130 ms; PFC, 230 ms). Black bars represent ROC values significantly different from 0.5 (95% confidence level, permutation test). E, Effect of direction range in sample on the match effect in test. The average ROC for each group of neurons, at the respective times of maximal effect, is shown as a function of preceding sample coherence. Test responses in both areas were reliably modulated by sample direction regardless of sample coherence (MT: p < 0.01, t test, at each range level; PFC: p < 0.01, t test, at 0 and 150° range; p < 0.05, t test, at 300° range). Error bars are ±1 SEM. sp/s, Spikes per second; deg, degree.
Figure 9.
Figure 9.
Task dependence of directional signals. A, Activity of an example MT neuron during the direction range task (top) and the no-task condition (bottom). The behavioral demands did not change either the response magnitude or the strong direction selectivity. B, Comparison of the directionality indices for a subset of neurons recorded in MT during task performance and the no-task condition. The task requirement did not significantly alter direction selectivity in either the sample (top) or the early period (first 500 ms) of the memory delay (p > 0.05, paired t test in each case). C, Activity of an example PFC during the direction range task (top) and during the no-task condition (bottom). When performance was not required, the directionality of the neuron was greatly diminished both during the sample and in the early delay. D, Directionality indices for PFC neurons recorded during the task and during the no-task condition. Note the significant decrease in directionality, both in the sample and the early delay, when the performance requirement is removed (p < 0.05, paired t test in each case). Insets, Bar plots show the average DI for the two conditions. Error bars are ±1 SEM.
Figure 10.
Figure 10.
Direction selectivity on error trials. A, Directionality of MT responses to sample during correct and error trials. Open circles show DI from the direction range task, and filled circles show DI from the direction accuracy task. Insets, Bar plot shows the average DIs for the two conditions, with no significant difference (p > 0.05, paired t test for both tasks). B, Directionality of MT responses to the test on correct and error trials. The average DI is not significantly different during correct and error trials in either task (p > 0.05, paired t test for both tasks). C, Directionality of PFC responses to sample on correct and error trials. There is a significant decrease in directionality on error trials in the direction range task (p ≪ 0.001, paired t test), but not in the accuracy task (p > 0.05, paired t test). D, Directionality of PFC responses to the test. Average DIs on error trials were significantly lower than that on correct trials in both tasks (range: p < 0.005, paired t test; accuracy: p < 0.05, paired t test). Error bars are ±1 SEM.
Figure 11.
Figure 11.
CP during the sample and delay. The relationship between firing rates and the monkeys' choices was evaluated with ROC analysis on trials when the sample contained no net direction (360° range). A, Average CP for 170 MT neurons during the sample and memory delay. A positive significant CP (p < 0.001, t test) was seen during the sample response, correlating higher firing rates with choices that indicated the sample as having been preferred. No such correlation was present from the end of the sample response through the entire memory delay. Light gray curves indicate ±1 SEM. B, Distributions showing CPs of individual neurons during the sample and three representative epochs of the delay. Significant individual CPs (95% confidence, permutation test) are indicated by black bars. C, Average CP for 40 PFC neurons during the sample and memory delay. No significant correlation between firing rates and choices (p > 0.05, t test) was seen at any time during the sample or memory delay. D, Distributions showing CPs of individual PFC neurons during the sample and three representative epochs of the delay. Details are as in B.
Figure 12.
Figure 12.
Representation of choice in the test response. A, Average CP in the test response, relating preferred test response rates to whether it was reported as the same as or different from the noncoherent (360° range) sample. Test responses in MT (left; n = 92) show no correlation with the decision (left), whereas test responses in the PFC (right; n = 35) show a significant decision correlate evolving with time. B, Distributions of CPs of individual neuron in both areas. Data for MT (left) were calculated for a 100 ms window covering the 100–200 ms epoch of the test response. Data for the PFC (right) were calculated for a 100 ms window centered at the time of the maximal CP, 380 ms after test onset. Significant CPs are indicated by black bars. C, Average CPs in the test response in each area as a function of sample direction range. When sample coherence was high (0 and 150° range), monkeys made very few errors, and thus the average CPs in both regions were similar to the average ROCs (see Fig. 8E) relating firing rates to the stimulus directions. However, at low or no sample coherence (300 and 360° range), test responses in MT did not correlate with decisions, whereas responses in the PFC did so with high reliability (p < 0.01 in both cases, t test). Error bars are ±1 SEM. deg, Degree.

Similar articles

Cited by

References

    1. Amemori K-i, Sawaguchi T. Rule-dependent shifting of sensorimotor representation in the primate prefrontal cortex. Eur J Neurosci. 2006;23:1895–1909. - PubMed
    1. Asaad WF, Rainer G, Miller EK. Task-specific neural activity in the primate prefrontal cortex. J Neurophysiol. 2000;84:451–459. - PubMed
    1. Baddeley A. Oxford: Clarendon/Oxford UP; 1986. Working memory.
    1. Baeg EH, Kim YB, Huh K, Mook-Jung I, Kim HT, Jung MW. Dynamics of population code for working memory in the prefrontal cortex. Neuron. 2003;40:177–188. - PubMed
    1. Baker JF, Petersen SE, Newsome WT, Allman JM. Visual response properties of neurons in four extrastriate visual areas of the owl monkey (Aotus trivirgatus): a quantitative comparison of medial, dorsomedial, dorsolateral, and middle temporal areas. J Neurophysiol. 1981;45:397–416. - PubMed

Publication types

MeSH terms

LinkOut - more resources