Comparative Study
. 2006 Nov 8;26(45):11786-97.
doi: 10.1523/JNEUROSCI.2939-06.2006.

Properties of somatosensory synaptic integration in cerebellar granule cells in vivo

Affiliations
Comparative Study

Properties of somatosensory synaptic integration in cerebellar granule cells in vivo

Henrik Jörntell et al. J Neurosci. .

Abstract

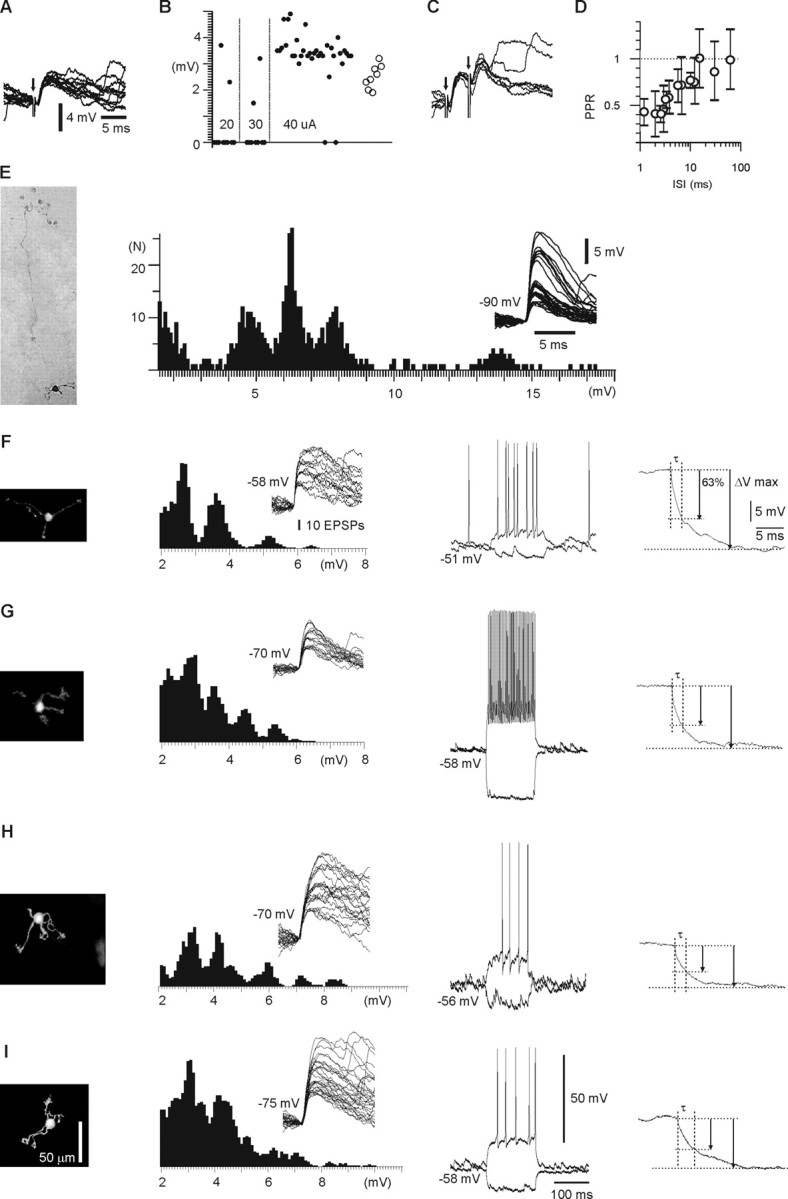
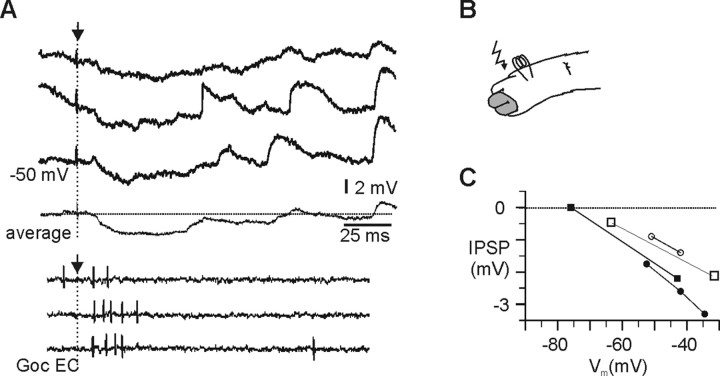
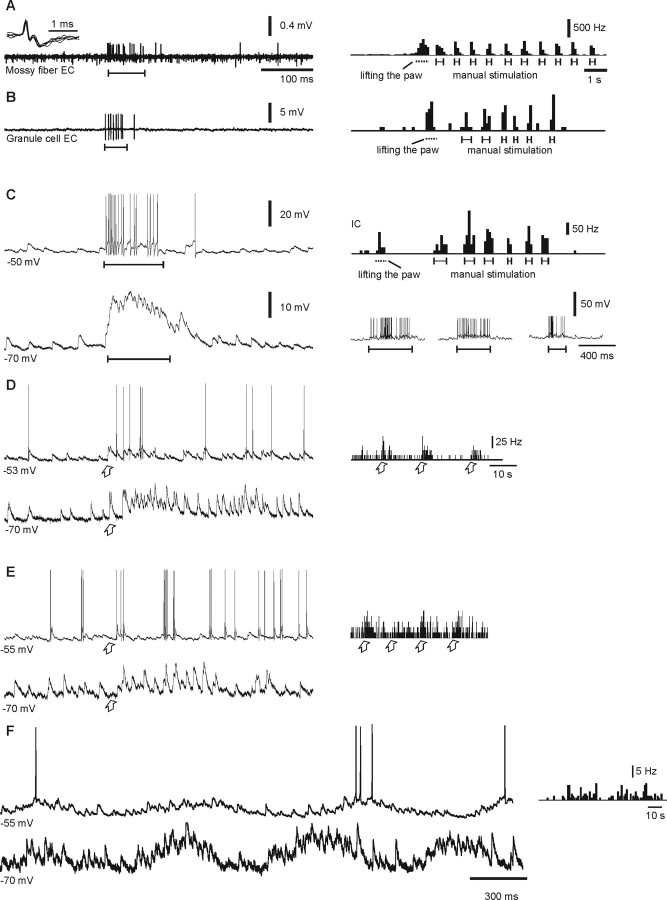
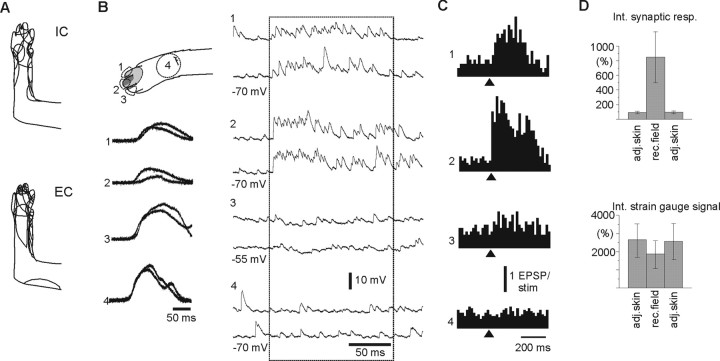
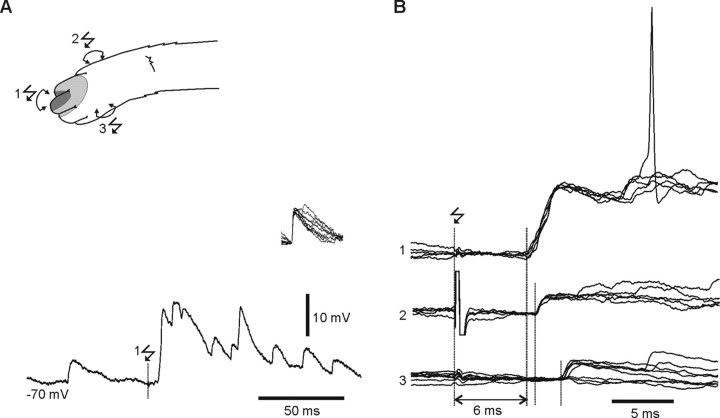
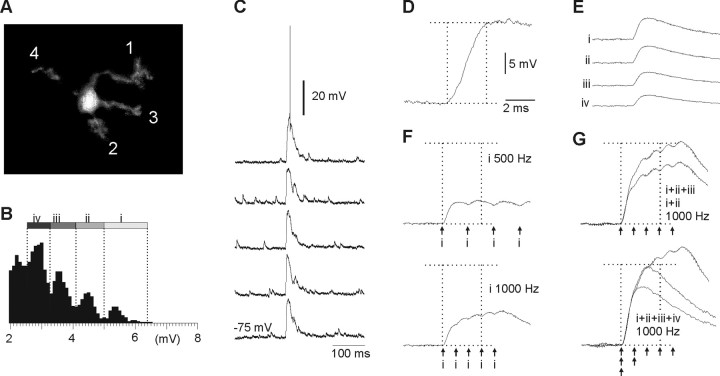
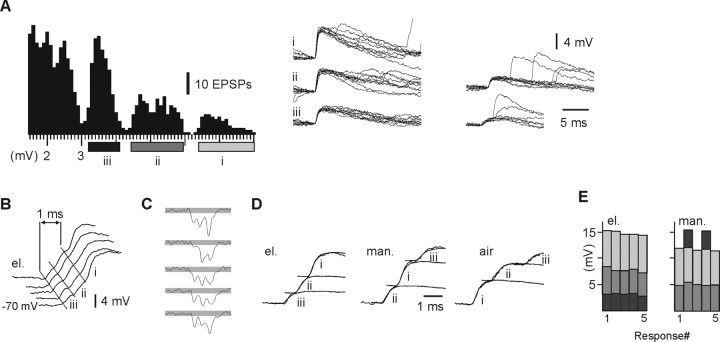
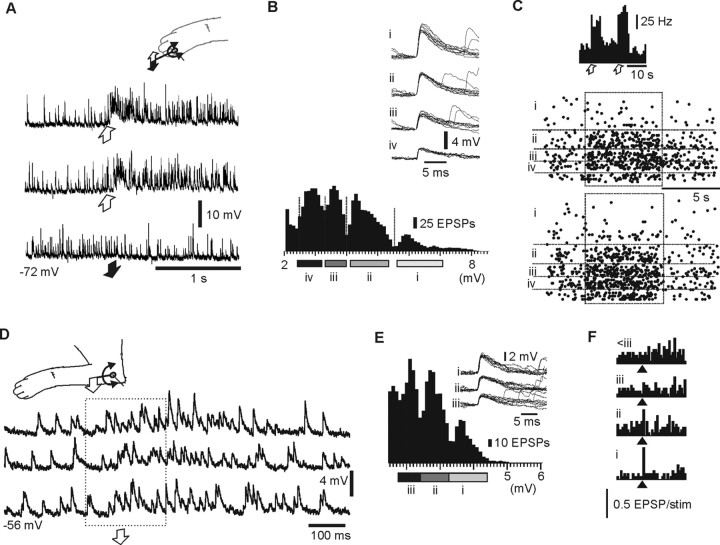
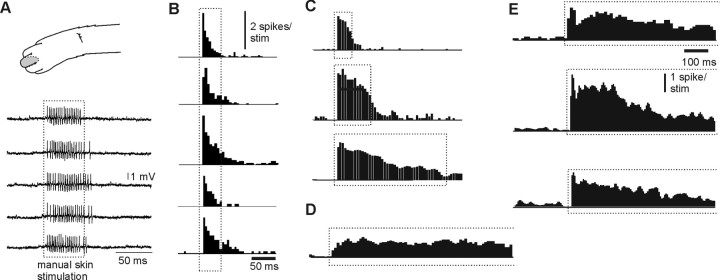
In decerebrated, nonanesthetized cats, we made intracellular whole-cell recordings and extracellular cell-attached recordings from granule cells in the cerebellar C3 zone. Spontaneous EPSPs had large, relatively constant peak amplitudes, whereas IPSPs were small and did not appear to contribute substantially to synaptic integration at a short time scale. In many cases, the EPSPs of individual mossy fiber synapses appeared to be separable by their peak amplitudes. A substantial proportion of our granule cells had small receptive fields on the forelimb skin. Skin stimulation evoked explosive responses in which the constituent EPSPs were analyzed. In the rising phase of the response, our analyses indicated a participation of three to four different mossy fiber synapses, corresponding to the total number of mossy fiber afferents. The cutaneous receptive fields of the driven EPSPs overlapped, indicating an absence of convergence of mossy fibers activated from different receptive fields. Also in granule cells activated by joint movements did we find indications that different afferents were driven by the same type of input. Regardless of input type, the temporal patterns of granule cell spike activity, both spontaneous and evoked, appeared to primarily follow the activity in the presynaptic mossy fibers, although much of the nonsynchronized mossy fiber input was filtered out. In contrast to the prevailing theories of granule cell function, our results suggest a function of granule cells as signal-to-noise enhancing threshold elements, rather than as sparse coding pattern discriminators or temporal pattern generators.


Figures

Figure 1.
Figure 1.
Basic properties of excitatory synaptic inputs and morphological identification. A, Overlay of EPSPs evoked by just suprathreshold mossy fiber stimulation (arrow). Calibrations apply to A and C. B, Responses evoked at subthreshold and suprathreshold stimulation intensities. EPSPs evoked at suprathreshold intensities (40 μA; solid circles) had a coefficient of variation of 14.5%. Open circles represent peak amplitudes of evoked EPSPs that were preceded (by ≤6 ms) by a spontaneous EPSP within the same amplitude range as the normal evoked EPSP (2.5–4.2 mV). Apart from these responses, all responses are shown in sequential order. C, Overlay of EPSPs evoked by paired-pulse stimulation with an interstimulus interval of 6 ms. Note that the apparent speeding of the decay phase of the second evoked EPSP primarily appears to be attributable to the fact that it is superimposed on the decay phase of the first evoked EPSP, resulting in a summation of decay phases. This was confirmed to be the case in a simulation of the EPSP responses evoked by paired-pulse stimulation (compare Fig. 6 below). D, Summary plot of all paired-pulse stimulations of mossy fiber-EPSPs (in 8 cells). The second evoked EPSP is plotted as the peak amplitude ratio (mean ± SD) relative to the first evoked EPSP. Just suprathreshold intensities were used. ISI, Interstimulus interval; PPR, paired-pulse ratio. E, Amplitude frequency histogram for spontaneous EPSPs in one cell. The coefficient of variation for EPSPs with peak amplitudes of 10.4–17.3 mV was 11.3%. The cell was stained with biocytin, and morphological reconstruction showed that this cell had four dendrites. Inset, Superimposed EPSPs with different amplitudes. Calibrations apply to F–I. F–I, Similar display as in E, but for four other granule cells stained with neurobiotin and reconstructed under the confocal microscope. Membrane responses to depolarizing and hyperpolarizing rectangular current steps are also shown for each of these cells when recorded at 0 bias current (calibrations in I). Current intensities in F–I are 20, 54, 24, and 32 pA, respectively. The insets at the far right show initial parts of the averaged membrane response to hyperpolarizing rectangular current steps for each cell as well as the method for calculating the time constant (τ). In F, a current step of −50 pA is used in the far right panel.
Figure 2.
Figure 2.
Properties of inhibitory responses. A, Responses evoked by electrical skin stimulation in an intracellular granule cell recording (3 raw traces and 1 averaged trace) and in an EC recording from a Golgi cell (Goc EC). Golgi cells were identified as detailed in Results (see Properties of cell-attached recordings). B, Location of electrical skin stimulation in relationship to the receptive field of the granule cell in A. C, Peak amplitudes of inhibitory responses plotted against membrane potential for three different cells. SDs (in the order of 10–20% of the averaged values) were not plotted because of relatively few data points (3–9) for each value.
Figure 3.
Figure 3.
Activity in granule cells with different types of peripheral input. A, Raw sweep and histogram of spike activity during manual cutaneous stimulation (indicated by capped lines) for EC recording from mossy fiber terminal with a fine-metal electrode. Note the negative field potential that follows the spike (inset) that represents the synaptic field potential of the mossy fiber terminal (Walsh et al., 1974; van Kan et al., 1993; Garwicz et al., 1998). The time scale applies to all raw traces in A–E. Bin width in histograms, 100 ms; the time scale applies to histograms in A–C. B, Display as in A, but from an EC granule cell recording in the cell-attached mode. C, Display as in B, but for an intracellular granule cell recording at 0 pA bias current (top) and at −70 mV (bottom). In the bottom right inset, three different raw traces of spike responses to manual stimulations of different durations are shown. D, Display as in C for a granule cell with strong activation on joint movement, the onset of which is indicated by empty arrows. The stimulation lasted for the remainder of the displayed sweep. Note the much longer time scale of the histogram in D. All calibrations apply to D and E. E, Display as in D for a granule cell with weak activation on joint movement. F, Intracellular activity in a granule cell without peripheral activation but with periodic spontaneous spike and EPSP activity.
Figure 4.
Figure 4.
Small receptive fields in granule cells activated from the skin. A, Overlaid outlines of granule cell cutaneous receptive fields from intracellular (IC; n = 19) and EC (n = 30) recordings. B, Evoked activity shown in raw sweeps of intracellular activity and peristimulus histograms of EPSPs during manual stimulation at different circumscribed skin sites (1–4). The corresponding strain-gauge signals (see Materials and Methods) are shown on the left (arbitrary units) to illustrate the fact that there was no bias to use higher manual stimulation intensities inside the receptive field (see also D). In the outline of the paw, the receptive field is indicated with 2 degrees of shading to indicate the sensitivity of the specific skin area. Note the slow hyperpolarizing response evoked from site 3 adjacent to the receptive field. C, Peristimulus histograms represent EPSPs evoked by light manual skin stimulation (stim) that was repeated 10–30 times for each skin site and display −300 to +500 ms relative to the onset of the stimulation with a bin width of 20 ms. D, Summarized data from 10 cells with cutaneous input. Net integrated synaptic responses (Int. synaptic resp.) evoked from the receptive field (rec. field) exceeded baseline EPSP activity by nearly 1000%. The integrated synaptic response from adjacent skin (adj. skin) sites (such as sites 3 and 4 in B) typically was much lower, whereas no input was evoked from other skin areas. For comparison, the net integrated strain-gauge signals (Int. strain-gauge signal) from these stimulations are shown below. Net integrated signals were calculated by dividing the rectified integrated signal from the first 50 ms after onset of stimulation with 50 ms of rectified and integrated prestimulus activity.
Figure 5.
Figure 5.
Electrical skin stimulation evokes reproducible, fixed-latency responses. A, Electrical skin stimulation within the center of the receptive field evoked a near instantaneous depolarizing step with a peak amplitude that was severalfold larger than the maximal unitary EPSP (inset). B, Superimposed successive responses to electrical skin stimulation delivered to the three skin sites indicated in A. Responses evoked outside the receptive field could sometimes lead to the activation of unitary EPSPs, probably through current spread to the outskirt of the receptive field. Note the constant response latency times in each case. The voltage calibration is the same as in A.
Figure 6.
Figure 6.
Simulation of the rising phases of responses evoked by skin stimulation. A, Morphology of a recorded granule cell with four dendritic endings. B, Amplitude frequency distribution histogram of spontaneous EPSPs. Numbers i–iv refer to EPSPs within distinct amplitude groups. C, Five consecutive responses evoked by electrical skin stimulation within the receptive field, which was located at the tip of the first digit and at the base of the second digit. The response latency time from stimulation was 6 ms (data not shown). D, Sample raw trace of the rising phase of the evoked response. Dotted lines indicate the time window within which all responses peaked. E, Averages of spontaneous EPSPs within amplitude groups i–iv. F, Simulated responses on repeated activation of an EPSP (i) at 500 and 1000 Hz. Summated responses were calculated with a 60% depression of the second EPSP compared with the first (compare Fig. 1 D); no additional depression was applied to the succeeding EPSPs. G, Simulated responses with temporal and spatial summation of various number of different EPSPs.
Figure 7.
Figure 7.
The rising phase of evoked responses is composed of different EPSPs. A, Amplitude frequency histogram for spontaneous EPSPs and superimposed raw traces of EPSPs from amplitude groups i–iii as well as smaller EPSPs of fast and slow types. B, Close-up of rising phases of responses evoked by electrical stimulation. Diagonal lines connect the approximate starting points for individual EPSPs. The response latency time from the periphery was 6–7 ms in all cases (data not shown). Calibrations apply to B and D. C, The derived signal from the traces in B. The gray area shows the range of the baseline noise. D, Individual averaged spontaneous EPSPs from amplitude groups i–iii could be used to reconstruct the rising phases of evoked responses evoked by electrical, manual, and air-puff stimulation within the receptive field. E, For five responses each, the recruitment order of EPSPs in evoked responses is shown for electrical (el.) and manual (man.) skin stimulation. The first evoked EPSP of each response is shown at the bottom of the graph, and the last is shown at the top. The correspondence between the amplitude of the evoked EPSPs and those of the amplitude frequency histogram in A is indicated by shading of the bars.
Figure 8.
Figure 8.
Activation of EPSPs in granule cells driven by joint movement. A, Raw traces of EPSP activity during flexion (open arrows) and extension (filled arrows) of digit 4 for a cell that was strongly activated by flexion of this digit only. B, Amplitude frequency histogram of the spontaneous EPSPs. Inset, Superimposed EPSPs from amplitude groups i–iv. C, Histogram and raster plots of EPSPs during two consecutive, mild dorsiflexions of digit 4. In the raster plots, EPSP amplitudes are plotted against time. D, Evoked EPSP activity in a cell weakly activated by extension of the elbow joint. E, Amplitude frequency histogram of the spontaneous EPSPs at −60 mV. F, Peristimulus histograms of the responses of EPSPs with different specific amplitudes evoked by elbow extension repeated 20 times [bin width of 20 ms, −300 to +500 ms relative to the onset of the stimulation (stim)] at a membrane potential of approximately −60 mV. Note the long duration of the response, outlasting the duration of the stimulation (indicated by dashed box). The arrowhead is aligned on the onset of the response rather than on the onset of the stimulation.
Figure 9.
Figure 9.
Similar responses in granule cells driven by the same type of input. A, Spike responses in an EC recorded granule cell with phasic skin responses to repeated short manual stimulation. The location of the receptive field is shown at the top. The duration of skin stimulation is indicated by the dotted box. B, Peristimulus histograms of spike responses in a set of EC recorded granule cells with similar receptive field properties as in A. Bin width, 5 ms. The same calibrations apply to B and C. C, Spike responses to skin stimulations of different durations in a single granule cell. D, Response to long-lasting cutaneous stimulations in a granule cell with a tonic input from the skin. Bin width, 10 ms. Calibrations are as in E. E, Spike responses to maintained joint bending in three granule cells with a tonic response component to joint movement. These cells responded to dorsal flexion of the wrist (2) and palmar flexion of the wrist. Bin width, 10 ms. stim, Stimulation.

Similar articles

Cited by

References

    1. Albus JS. A theory of cerebellar function. Math Biosci. 1971;10:25–61.
    1. Apps R, Garwicz M. Anatomical and physiological foundations of cerebellar information processing. Nat Rev Neurosci. 2005;6:297–311. - PubMed
    1. Brickley SG, Cull-Candy SG, Farrant M. Development of a tonic form of synaptic inhibition in rat cerebellar granule cells resulting from persistent activation of GABAA receptors. J Physiol (Lond) 1996;497:753–759. - PMC - PubMed
    1. Brickley SG, Revilla V, Cull-Candy SG, Wisden W, Farrant M. Adaptive regulation of neuronal excitability by a voltage- independent potassium conductance. Nature. 2001;409:88–92. - PubMed
    1. Brodal P, Bjaalie JG. Organization of the pontine nuclei. Neurosci Res. 1992;13:83–118. - PubMed

Publication types

MeSH terms

LinkOut - more resources