. 2007 Feb;97(2):1775-85.
doi: 10.1152/jn.00955.2006. Epub 2006 Nov 8.

Selective removal of lateral olivocochlear efferents increases vulnerability to acute acoustic injury

Affiliations

Selective removal of lateral olivocochlear efferents increases vulnerability to acute acoustic injury

Keith N Darrow et al. J Neurophysiol. 2007 Feb.

Abstract

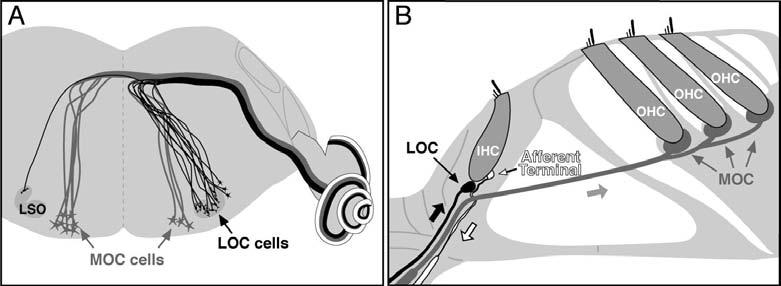
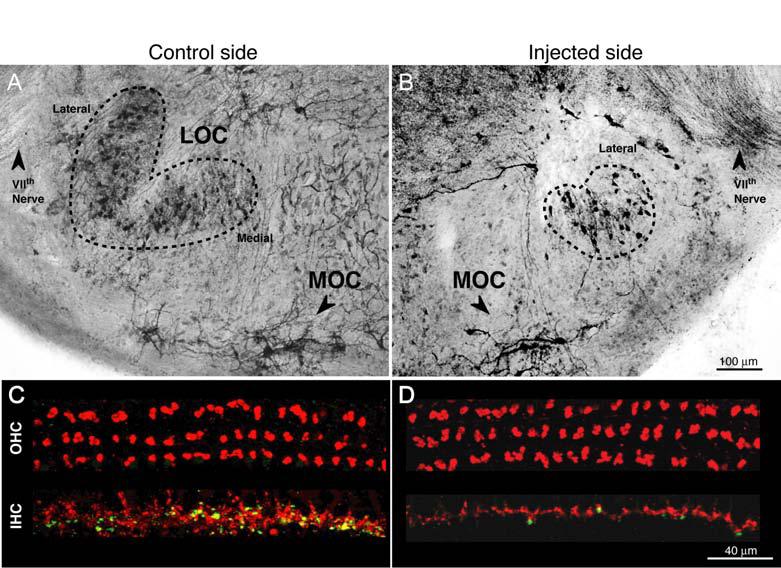
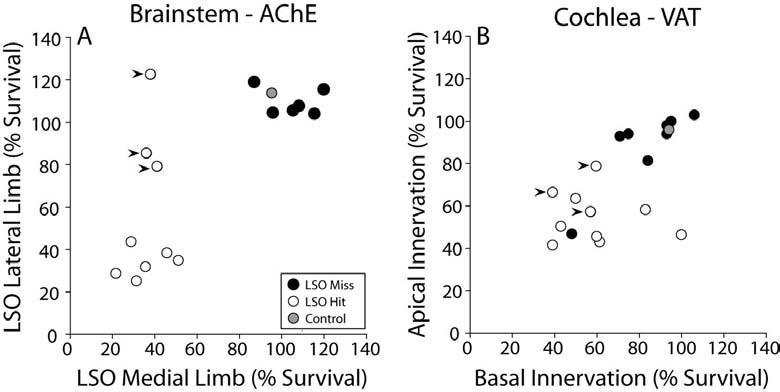
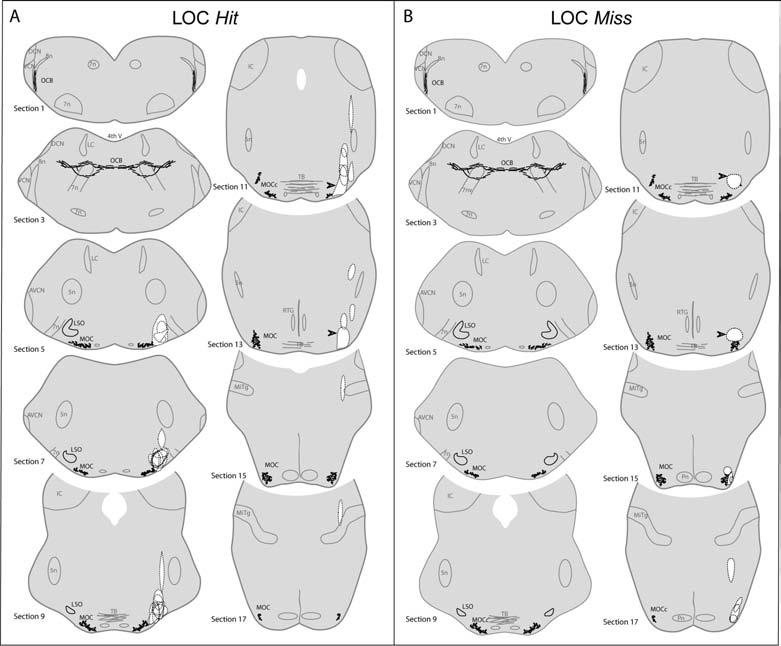
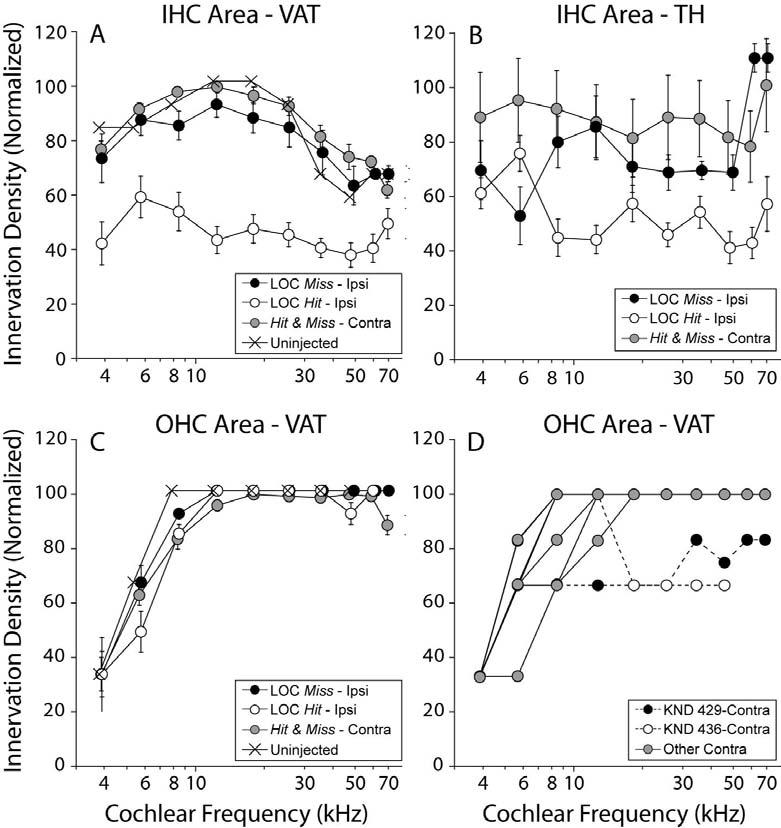
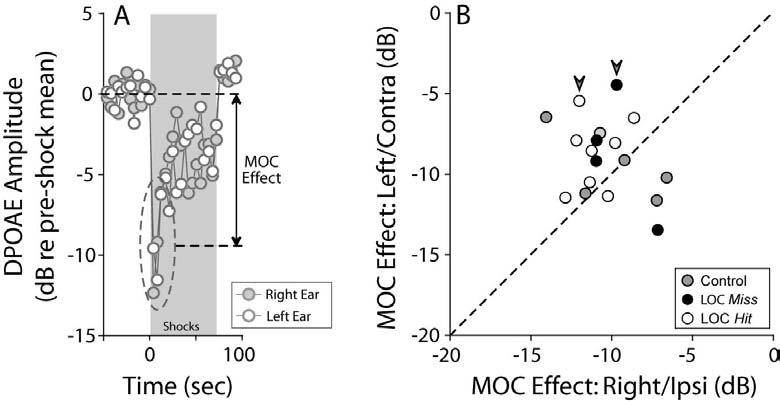
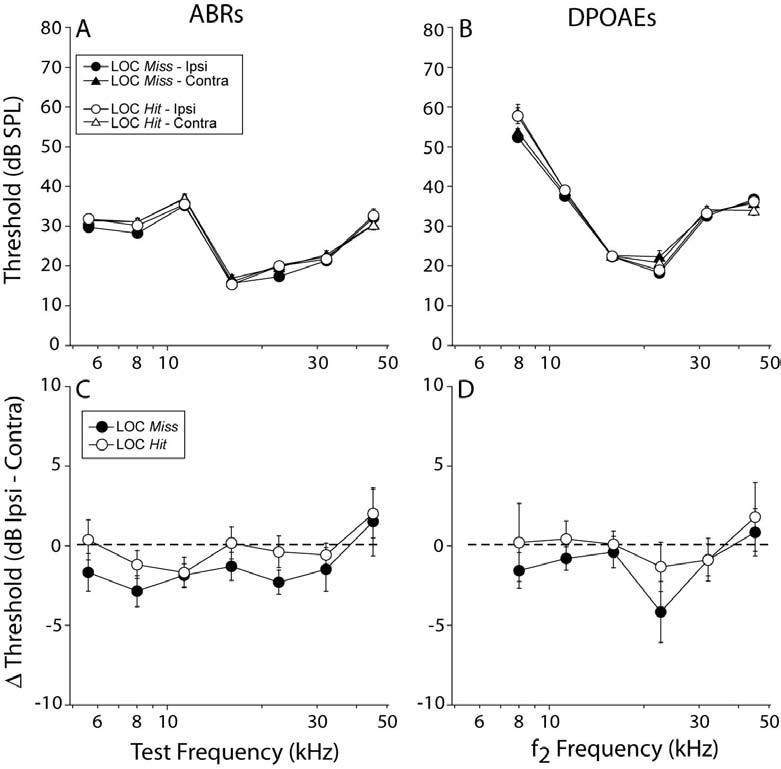
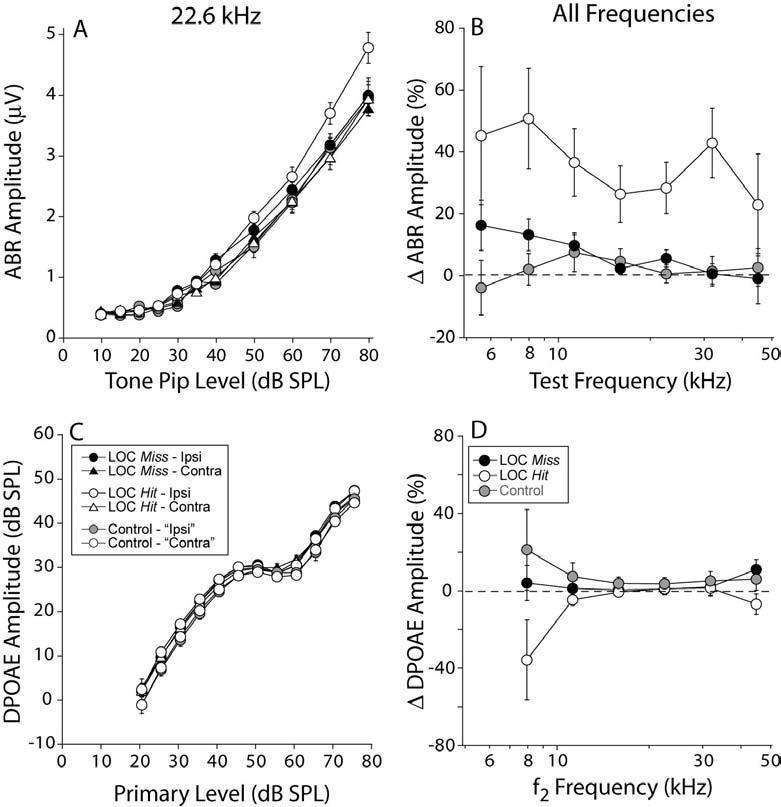
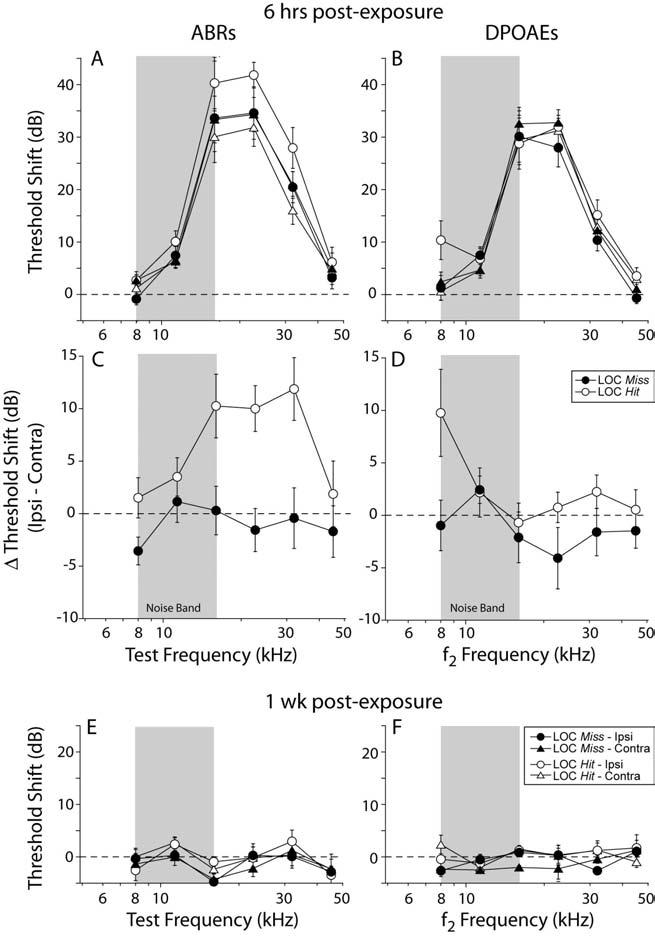
Cochlear sensory cells and neurons receive efferent feedback from the olivocochlear (OC) system. The myelinated medial component of the OC system and its effects on outer hair cells (OHCs) have been implicated in protection from acoustic injury. The unmyelinated lateral (L)OC fibers target ipsilateral cochlear nerve dendrites and pharmacological studies suggest the LOC's dopaminergic component may protect these dendrites from excitotoxic effects of acoustic overexposure. Here, we explore LOC function in vivo by selective stereotaxic destruction of LOC cell bodies in mouse. Lesion success in removing the LOC, and sparing the medial (M)OC, was assessed by histological analysis of brain stem sections and cochlear whole mounts. Auditory brain stem responses (ABRs), a neural-based metric, and distortion product otoacoustic emissions (DPOAEs), an OHC-based metric, were measured in control and surgical mice. In cases where the LOC was at least partially destroyed, there were increases in suprathreshold neural responses that were frequency- and level-independent and not attributable to OHC-based effects. These interaural response asymmetries were not found in controls or in cases where the lesion missed the LOC. In LOC-lesion cases, after exposure to a traumatic stimulus, temporary threshold shifts were greater in the ipsilateral ear, but only when measured in the neural response; OHC-based measurements were always bilaterally symmetric, suggesting OHC vulnerability was unaffected. Interaural asymmetries in threshold shift were not found in either unlesioned controls or in cases that missed the LOC. These findings suggest that the LOC modulates cochlear nerve excitability and protects the cochlea from neural damage in acute acoustic injury.


Figures

Figure 1
Figure 1
Anatomical schematics illustrate the central origins (A) and peripheral projections (B) of the medial and lateral components of the olivocochlear (OC) efferent system. Bold arrows in B indicate direction of action potential transmission. Estimates of MOC and LOC distributions patterns in mouse, i.e. 75% contralateral and 99% ipsilateral (A) are from Campbell and Henson (1988).
Figure 2
Figure 2
Histological verification of LOC lesions, as seen in AChE-stained brainstem sections (A,B) or in cochlear whole mounts double-immunostained for a cholinergic marker (red) and a dopaminergic marker (green). (C,D). A,B: Brainstems are from opposite sides of one LOC Hit case. Dashed lines indicate the outline of the surviving LSO in each section: on the control side, lateral and medial limbs are indicated. The AChE-positive fibers of the VIIth nerve, visible in each section, were used to identify comparable rostro-caudal locations on the two sides. Scale in B also applies to A. C,D: images are from the 22.6 kHz region of opposite sides of a LOC Hit case (different from the one shown in A and B). Scale in D also applies to C.
Figure 3
Figure 3
Analysis of lesion success based on (A) the fractional survival of the LSO, as seen in AChE-stained brainstem sections, and (B) the fractional survival of cholinergic terminals in the IHC area, as seen in immunostained cochlear whole mounts. Filled arrowheads in B are the three cases in A (filled arrowheads) where the lesion affected the medial limb only. A: Fractional survival is the total surviving area (as depicted in Fig. 2A,B) of each LSO limb from its rostral to caudal extent (the LSO spans ∼480 μm in the rostro-caudal plane), normalized to the mean area of control sides. B: Fractional survival of cholinergic (VAT-positive) terminals in the IHC area is calculated by dividing the cochlear spiral into two bins (apical vs. basal to the midpoint), and averaging the semi-quantitative estimates of fractional survival in each bin for each case. See Methods for further details.
Figure 4
Figure 4
Lesion locations in all LOC Hit cases (A) and LOC Miss cases (B). In each case, the lesion is outlined (dashed lines, white centers) and superimposed on “atlas” sections (derived from an AChE-stained control mouse). Alternate 80 μm sections are shown: Section 1 is the most caudal, and Section 17 the most rostral to include the OC system. One case from each group with partial damage to MOC system is indicated by arrowheads in Sections 11 and 13. Abbreviations are: 4th V,4th ventricle; 5n, trigeminal nerve or nucleus; 7n, facial nerve or nucleus; 8n, cochlear nerve; AVCN, anteroventral cochlear nucleus; DCN, dorsal cochlear nucleus; IC, inferior colliculus; LC, locus coeruleus; LSO, lateral superior olive; MiTg, Microcellular tegmental nucleus; MOC, medial olivocochlear cells; OCB, olivocochlear bundle; Pn, pontine nuclei; RTG, reticulotegmental nucleus; TB, trapezoid body.
Figure 5
Figure 5
Semi-quantitative analysis of cholinergic (VAT: A,C,D) and dopaminergic (TH: B) markers in the IHC (A,B) and OHC (C,D) areas. In each cochlea, innervation density was estimated at 10 locations along the cochlear spiral (apical and basal halves of each of 5 dissected pieces). In A-C, the mean (±SEM) innervation density in ipsilateral ears from LOC Hit (open circles; n = 10) and LOC Miss (dark-filled circles; n = 8) are compared to all contralateral ears (grey-filled circles; n = 19) and uninjected controls (n=2). The key in A also applies to B and C. In D, individual contralateral ears from C are shown to indicate the two cases (dashed lines) with decreased terminal density in the OHC area. See Methods for description of analysis procedures.
Figure 6
Figure 6
Bilateral suppression of DPOAEs, elicited via midline electrical stimulation of MOC fibers, suggests that MOC function is minimally affected by the lesions. A: One run of the MOC assay in a control case demonstrates symmetrical DPOAE suppression in right and left ears. “MOC effect” is defined as the dB difference between mean DPOAE amplitude in the first three measures after shock onset, compared to the pre-shock baseline. B: MOC effects in right and left ears of control, LOC Hit and LOC Miss cases. Large arrowheads indicate the cases with histological evidence of MOC lesions (Figures 3, 4, and 5D). For data shown, f2 was 22.6 kHz.
Figure 7
Figure 7
Mean cochlear thresholds (±SEM), as measured by ABR (A) and DPOAE (B) were not affected by a successful LOC lesion, nor were interaural threshold differences as measured by either ABR (C) or DPOAE (D). Keys in A and C also apply to B and D, respectively.
Figure 8
Figure 8
ABR amplitudes (A,B) are enhanced in the ipsilateral LOC Hit ears and not in LOC Miss ears, whereas DPOAE amplitudes (C,D) are unaffected in all groups. A,C: Mean (±SEM) amplitude vs. level functions for ABR and DPOAE, respectively, for responses at 22.6 kHz: key in panel C applies to A. B,D: mean interaural discrepancies in ABR and DPOAE amplitudes, respectively. Key in D applies to B. See text for further details.
Figure 9
Figure 9
Mean ABR threshold shifts in LOC Hit mice, 6 hrs after acoustic overexposure, were 10-15 dB higher in the ipsilateral ear; this asymmetry was not present in LOC Miss cases (A,C) or in the mean DPOAE data from either Hit or Miss groups (B,D). A,B: threshold shift is defined as the difference from mean pre-exposure values for the same group. C,D: interaural threshold-shift difference defined as thresholds in ipsilateral minus contralateral ears of each case. At 1 wk post exposure, mean ABR (E) and DPOAE (F) threshold shifts returned to pre-exposure levels. Key in F, also applies to A,B and E. Key in D also applies to C. Error bars in all panels indicate ±SEMs. Grey box indicates noise exposure bandwidth.

Comment in

References

    1. Adams JC. Sound stimulation induces Fos-related antigens in cells with common morphological properties throughout the auditory brainstem. J Comp Neurol. 1995;361:645–668. - PubMed
    1. Arnold T, Oestreicher E, Ehrenberger K, Felix D. GABAA receptor modulates the activity of inner hair cell afferents in guinea pig cochlea. Hear Res. 1998;125:147–153. - PubMed
    1. Bailey GP, Sewell WF. Calcitonin Gene-Related Peptide suppresses Hair Cell Responses to Mechanical Stimulation in the Xenopus Lateral Line Organ. J Neuroscience. 2000;20:5163–5169. - PMC - PubMed
    1. Bao J, Lei D, Du Y, Ohlemiller KK, Beaudet AL, Role LW. Requirement of nicotinic acetylcholine receptor subunit beta2 in the maintenance of spiral ganglion neurons during aging. J Neurosci. 2005;25:3041–3045. - PMC - PubMed
    1. Brown MC. Morphology of labeled efferent fibers in the guinea pig cochlea. J Comp Neurol. 1987;260:605–618. - PubMed

Publication types

Substances

LinkOut - more resources