. 2006 Nov 29;25(23):5603-13.
doi: 10.1038/sj.emboj.7601421. Epub 2006 Nov 9.

Snail activation disrupts tissue homeostasis and induces fibrosis in the adult kidney

Affiliations

Snail activation disrupts tissue homeostasis and induces fibrosis in the adult kidney

Agnès Boutet et al. EMBO J. .

Abstract

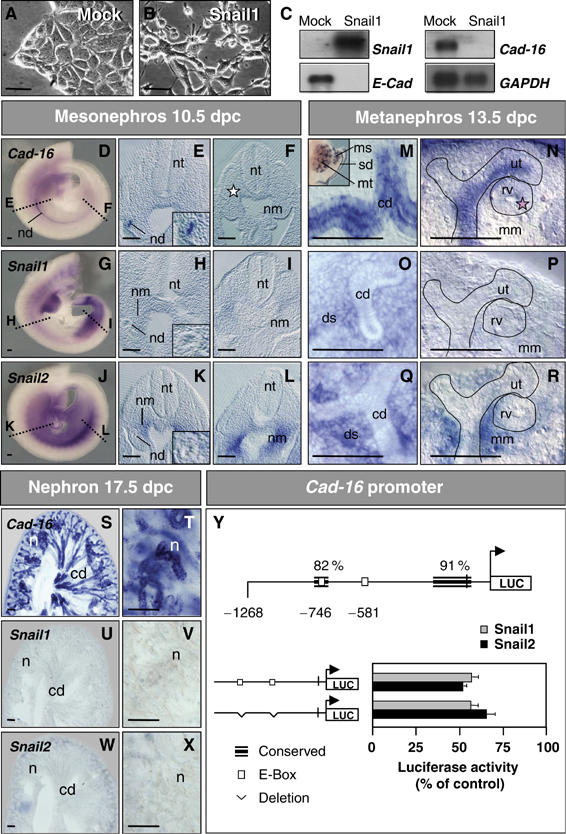
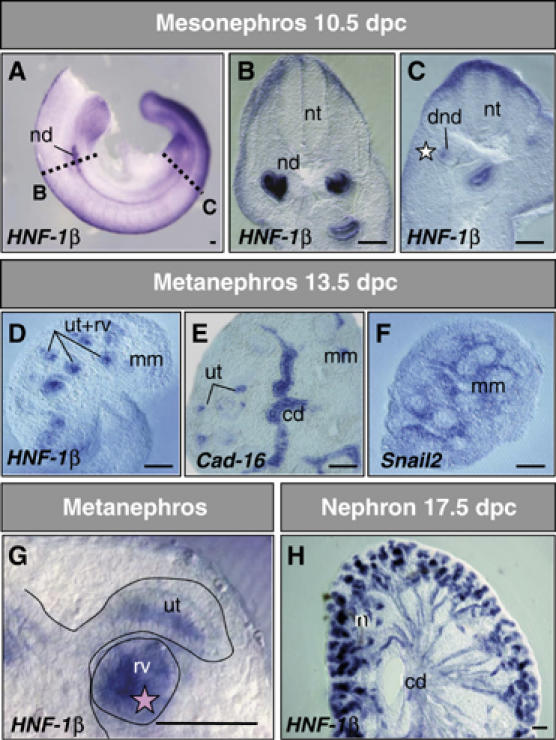
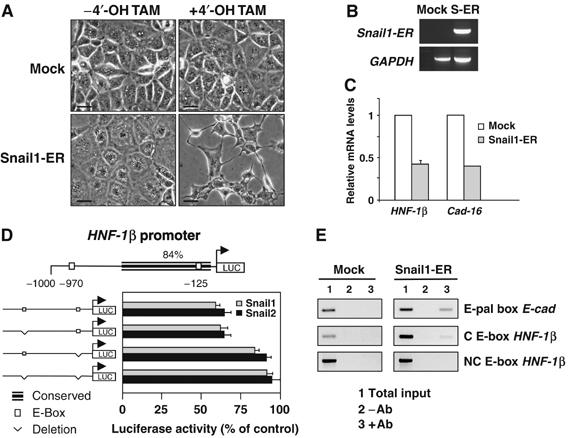
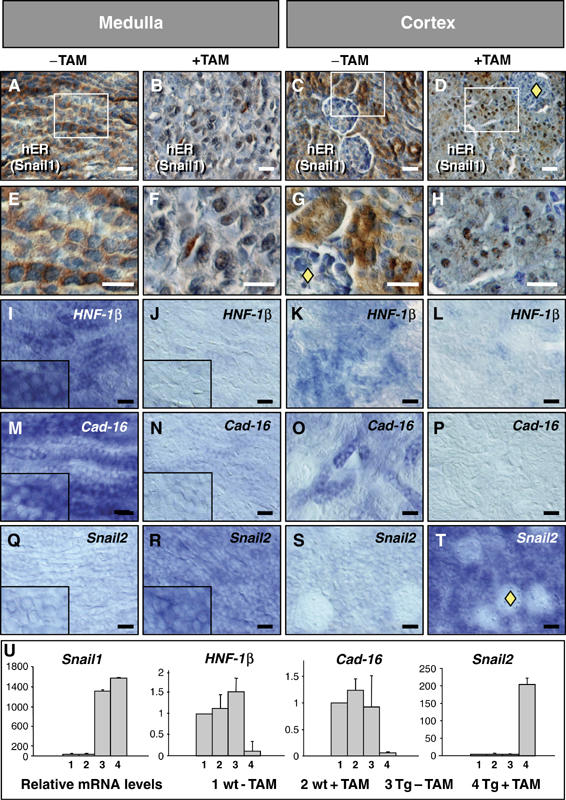
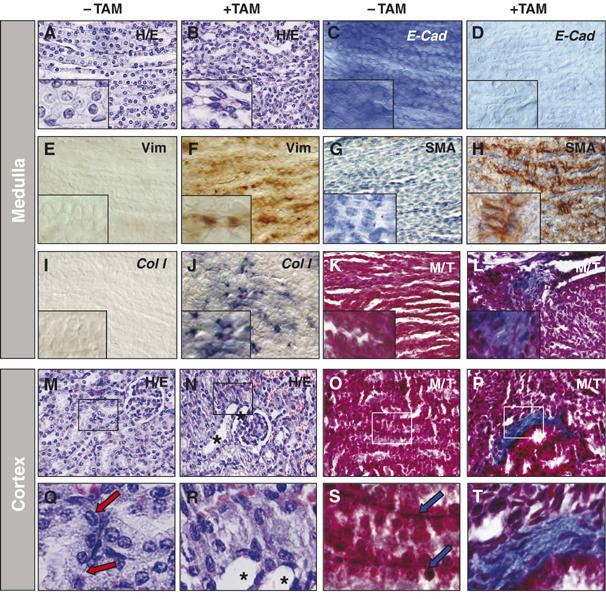
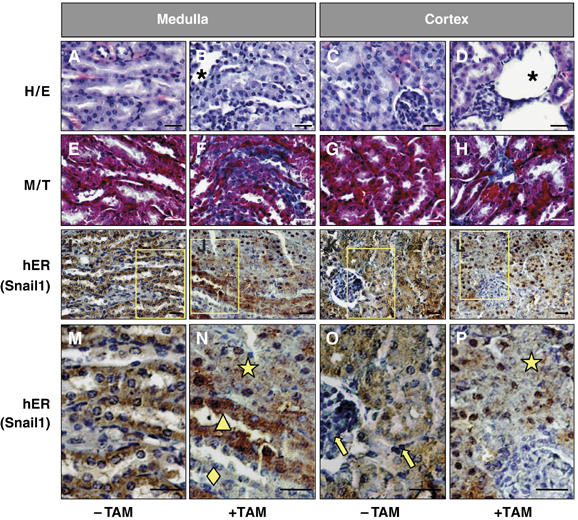
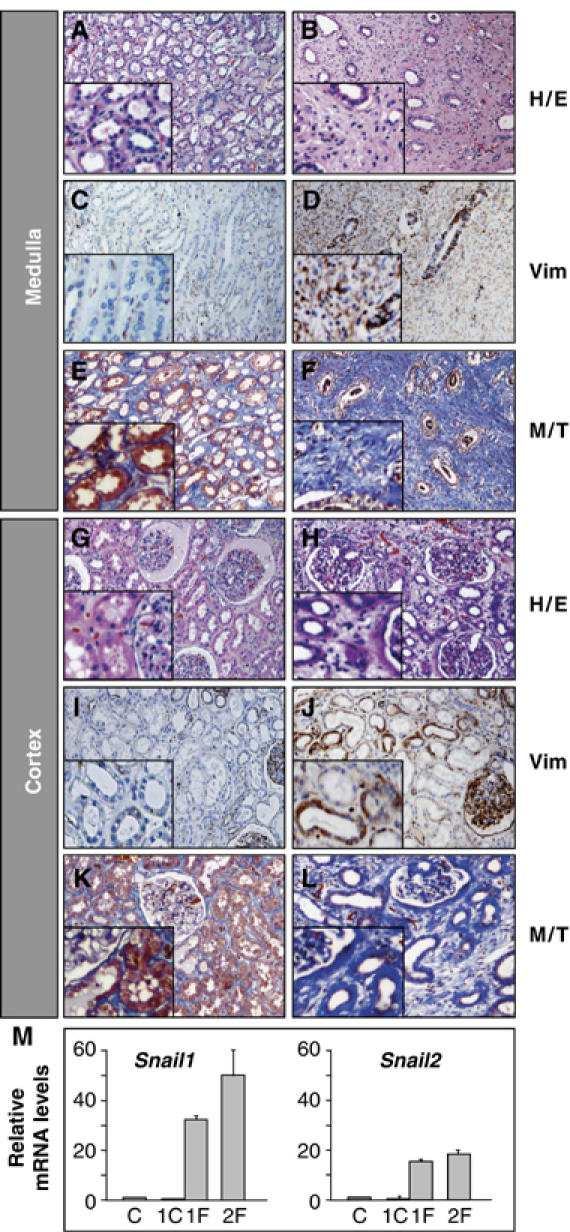
During embryonic development, the kidney epithelium originates from cells that undergo a mesenchymal to epithelial transition (MET). The reverse process, epithelium to mesenchyme transition (EMT), has been implicated in epithelial tumor progression and in the fibrosis that leads to end-stage kidney failure. Snail transcription factors induce both natural and pathological EMT, but their implication in renal development and disease is still unclear. We show that Snail genes are downregulated during the MET that occurs during renal development and that this is correlated with Cadherin-16 expression. Snail suppresses Cadherin-16 via the direct repression of the kidney differentiation factor HNF-1beta, a novel route by which Snail disrupts epithelial homeostasis. Indeed, Snail activation is sufficient to induce EMT and kidney fibrosis in adult transgenic mice. Significantly, Snail is also activated in patients with renal fibrosis. Thus, Snail expression is suppressed during renal development and it must remain silent in the mature kidney where its aberrant activation leads to fibrosis.


Figures

Figure 1
Figure 1
Snail1 represses the kidney epithelial Cadherin-16 both in cell culture and in the embryo. (A, B) Phase-contrast images and (C) Snail1, E-Cadherin and Cadherin-16 expression in stable mock- and Snail1-transfected cells. Snail1 expression represses E-cadherin and Cadherin-16 transcription. GAPDH levels are shown as a control. (DX) ISH for Cadherin-16, Snail1 and Snail2 in whole-mount mouse embryos and transverse sections taken at the mid (E, H, K) and posterior (F, I, L) trunk levels. Cadherin-16 is expressed in the newly formed nephric duct epithelium (nd, E) that no longer expresses Snail genes (H, K insets). Snail transcripts are observed in the undifferentiated anterior (H, K) and posterior (I, L) nephrogenic mesenchyme (nm). Dissected urogenital system (see M, inset) or gelatin sections (M–R) hybridized with Cadherin-16 and Snail probes. Cadherin-16 is expressed in the collecting duct epithelia (M) and their ureteric tips (ut, N) of the developing metanephros but it is absent from the newly forming renal vesicle (pink star, rv; N). Expression is also detected in the sexual ducts and in the tubules of the transient mesonephros (sd and ms; M, inset). Snail1 and Snail2 expression is restricted to the metanephric mesenchyme and to the deep stroma (mm and ds, O–R). Nephrons (n) appear after the complete epithelialization of the metanephric mesenchyme. The nephron epithelia and the collecting ducts (cd) strongly express Cadherin-16 (S, T), whereas Snail1 and Snail2 expression disappears when the mesenchyme transforms into epithelia (U–X). nt, neural tube. Scale bar, 100 μm. (Y) Snail proteins repress the Cadherin-16 promoter. Schematic representation of the mouse Cadherin-16 promoter showing the regions of high similarity between mouse and human, and the location of the consensus Snail-binding sequences (white boxes). Luciferase reporter constructs carrying the wild-type mouse Cadherin-16 promoter (−1268) or deletions in the two E-boxes were assayed in the NMuMG cells together with either the mouse Snail1 or Snail2 expression vectors or an empty vector as a control (pcDNA3). Luciferase activity was measured 24 h after transfection and the activity is expressed relative to that of the wild-type construct. The results are the mean values±S.E. of duplicates from four independent experiments. Deletions of the Snail-binding sites do not relieve the repression of the Cadherin-16 promoter activity.
Figure 2
Figure 2
HNF-1β expression precedes that of Cadherin-16 in the developing kidney epithelia. (AH) ISH of embryos or dissected kidneys. HNF-1β expression was observed in the epithelia at all stages of kidney development. At 10.5 dpc, HNF-1β transcripts are seen in the nephric duct (nd, B) and in the condensing mesenchyme of the differentiating posterior nephric duct (dnd, C), which is still devoid of Cadherin-16 transcripts (white star in Figure 1F). At 13.5 dpc, in addition to the collecting duct (cd), the ureteric tips of the ducts (ut) and the renal vesicle (rv) contain HNF-1β transcripts (D, G), some of which remain negative for Cadherin-16 (E and pink star in Figure 1N). Snail2 is expressed in the metanephric mesenchyme (mm) but not in the areas expressing HNF-1β. (H) At 17.5 dpc, the epithelia of the nephrons (n) and the collecting ducts express high levels of HNF-1β and both Snail genes have been downregulated (Figure 1U–X). nt, neural tube; scale bars, 100 μm.
Figure 3
Figure 3
Snail genes directly repress HNF-1β transcription, which in turn impairs Cadherin-16 expression. (A) NMuMG cells stably transfected with an inducible Snail1 construct (Snail1-ER) or with the empty vector (Mock) were analyzed 24 h after induction. Note the phenotypic change of the Snail1-transfected cells upon 4′-OH-tamoxifen (4′-OH-TAM) administration. Scale bar, 25 μm. (B) Transgene expression visualized by RT–PCR in Mock and Snail1-ER transfectants (S-ER). (C) Quantitative RT–PCR for Cadherin-16 and HNF-1β 24 h after 4′-OH-tamoxifen administration. (D) Diagram of the 1 kb region upstream of the translational initiation site in the mouse HNF-1β gene showing regions highly conserved between mouse and human. Of the two consensus E-boxes for Snail binding, only one lies within the conserved region. Snail1 and Snail2 repressed the activity of the wild-type HNF-1β promoter (measured as described for the Cadherin-16 promoter), but they did not affect the promoter constructs in which the conserved E-box was deleted. (E) ChiP analyses show that Snail1 binds directly to the HNF-1β promoter. ChIP assays were carried out with anti-ER antibodies on Mock- and Snail1-ER cells 24 h after induction. As a positive control, the interaction of Snail with the E-pal element of the E-cadherin promoter is shown. Snail does not bind to the nonconserved (NC) E-box in the HNF-1β promoter. Amplifications of the indicated promoter regions in the input (1), nonimmunoprecipitated (2) and immunoprecipitated (3) fractions are shown. The data presented are representative of three independent experiments.
Figure 4
Figure 4
Snail expression induces the loss of the epithelial character in postnatal transgenic kidneys. (AH) Exogenous Snail1 protein was translocated to the nucleus upon tamoxifen (TAM) administration, as seen with an anti-hER antibody in both the medulla and the cortex. Note the absence of the transgenic protein in the glomeruli (yellow diamonds). (I–P) HNF-1β (I–L) and Cadherin-16 expression (M–P) in sections from 2-week-old transgenic kidneys show the loss of the two epithelial and differentiation markers. (QT) Snail1 activation also induces Snail2 expression but not in the glomeruli (yellow diamond in T). (U) Quantitative RT–PCR analysis of Snail1, HNF-1β, Cadherin-16 and Snail2 expression in wild-type and transgenic kidneys in the absence or presence of TAM. Transcription is normalized to GAPDH mRNA expression and the error bars represent the standard error of the mean.
Figure 5
Figure 5
Snail expression induces EMT and features of fibrosis in postnatal transgenic mice. (A, B) Hematoxylin/eosin staining of sections from the kidneys shown in Figure 4. Note the depolarized and fibroblast morphology of the collecting duct cells in the medulla region of animals treated with tamoxifen (+TAM). (C, D) E-Cadherin expression is completely downregulated in the kidneys of transgenic mice upon Snail1 activation, confirming the loss of epithelial character. (E–H) Snail 1 activation also induces the expression of vimentin (E, F) and smooth muscle actin (SMA, G, H), both indicating the appearance of mesenchymal characteristics. (I–L) Collagen I transcripts (I, J) and Collagen fibrotic deposits (K, L) detected by Masson–Trichrome staining in the transgenic kidneys upon Snail1 activation. (M–T) Similar signs of epithelial disruption and fibrosis are also observed in the cortex of the transgenic kidneys from tamoxifen-treated mice. Hematoxylin/eosin staining (M, N) and collagen deposits (O, P). (Q–T) High-power images to better assess the dilation of renal tubules (asterisks) and the disruption of basement membranes upon Snail1 activation. Basement membranes that can be clearly observed in the untreated transgenic kidneys (arrows).
Figure 6
Figure 6
Snail activation is sufficient to induce renal fibrosis in adult transgenic mice. (AD) Hematoxylin/eosin staining of sections from 4-month-old transgenic mice kidneys. Tamoxifen treatment in mice (+TAM) was initiated 2 months after birth. Note the defective overall morphology including the presence of dilated tubules. (EH) Fibrotic deposits can be observed by Masson–Trichrome staining in tamoxifen-treated mice. Fibrosis is also manifested by the presence of cysts (D). (I–P) Detection of the transgenic Snail1 protein with an anti-hER antibody (brown) in paraffin sections counterstained with hematoxylin (blue). Note the absence of transgenic protein in the glomeruli and in the interstitial cells (yellow arrows in O) and in some ducts in the medulla (yellow diamond in N). The yellow triangle in (N) indicates ducts in which the Snail1 protein has not been efficiently translocated to the nucleus (note the blue nuclei and brown cytoplasms). The ducts and tubules with Snail1 nuclear expression lost the epithelial character and present a completely disorganized structure (yellow star in N and P). Scale bars, 25 μm.
Figure 7
Figure 7
Fibrotic human kidneys show strong Snail expression. Sections from normal human kidney tissue (A, C, E, G, I, K) and from a patient subjected to nephrectomy due to urinary obstruction and kidney failure (B, D, F, H, J, L) showing hematoxylin/eosin staining (H/E), vimentin expression (Vim) and fibrotic deposits in blue following Masson–Trichome staining (M/T). (M) Quantitative RT–PCR analysis of Snail1 and Snail2 expression in normal human kidney tissue (C, n=4), nonfibrotic (1C) and fibrotic tissue from patient 1 (1F) and patient 2 (2F). Transcript levels are normalized to GAPDH mRNA expression and the error bars represent the standard error of the mean.

References

    1. Alexakis C, Maxwell P, Bou-Gharios G (2005) Organ-specific collagen expression: implications for renal disease. Nephron Exp Nephrol 102: e71–e75 - PubMed
    1. Aybar M, Nieto MA, Mayor R (2003) Snail precedes Slug in the genetic cascade required for the specification and migration of the Xenopus neural crest. Development 130: 483–494 - PubMed
    1. Bai Y, Pontoglio M, Hiesberger T, Sinclair AM, Igarashi P (2002) Regulation of kidney-specific Ksp-cadherin gene promoter by hepatocyte nuclear factor-1β. Am J Physiol Renal Physiol 283: F839–F851 - PubMed
    1. Barrallo-Gimeno A, Nieto MA (2005) The Snail genes as inducers of cell movement and survival: implications in development and cancer. Development 132: 3151–3161 - PubMed
    1. Batlle E, Sancho E, Franci C, Dominguez D, Monfar M, Baulida J, Garcia De Herreros A (2000) The transcription factor snail is a repressor of E-cadherin gene expression in epithelial tumour cells. Nat Cell Biol 2: 84–89 - PubMed

Publication types

MeSH terms