. 2006 Nov 21;103(47):17741-6.
doi: 10.1073/pnas.0604237103. Epub 2006 Nov 9.

Cooperative deformation of mineral and collagen in bone at the nanoscale

Affiliations

Cooperative deformation of mineral and collagen in bone at the nanoscale

Himadri S Gupta et al. Proc Natl Acad Sci U S A. .

Abstract

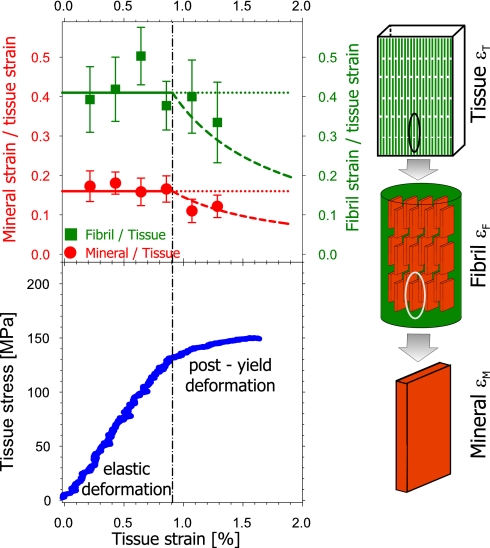
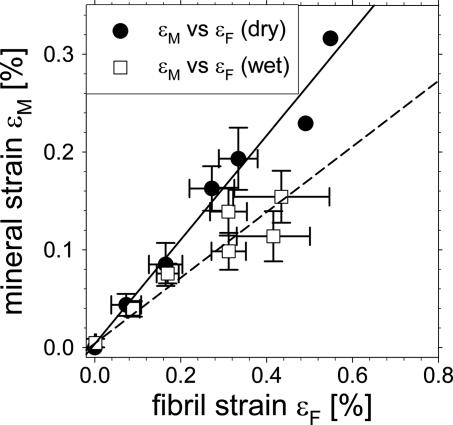
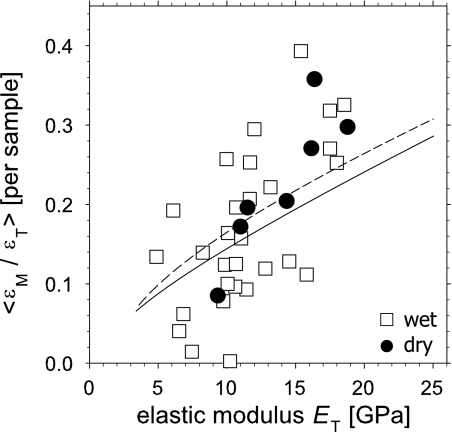
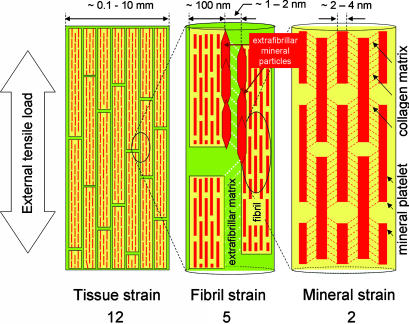
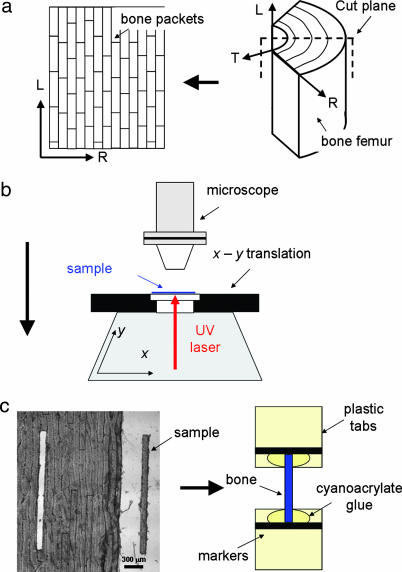
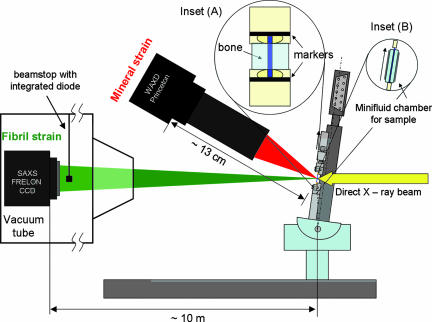
In biomineralized tissues such as bone, the recurring structural motif at the supramolecular level is an anisotropic stiff inorganic component reinforcing the soft organic matrix. The high toughness and defect tolerance of natural biomineralized composites is believed to arise from these nanometer scale structural motifs. Specifically, load transfer in bone has been proposed to occur by a transfer of tensile strains between the stiff inorganic (mineral apatite) particles via shearing in the intervening soft organic (collagen) layers. This raises the question as to how and to what extent do the mineral particles and fibrils deform concurrently in response to tissue deformation. Here we show that both mineral nanoparticles and the enclosing mineralized fibril deform initially elastically, but to different degrees. Using in situ tensile testing with combined high brilliance synchrotron X-ray diffraction and scattering on the same sample, we show that tissue, fibrils, and mineral particles take up successively lower levels of strain, in a ratio of 12:5:2. The maximum strain seen in mineral nanoparticles (approximately 0.15-0.20%) can reach up to twice the fracture strain calculated for bulk apatite. The results are consistent with a staggered model of load transfer in bone matrix, exemplifying the hierarchical nature of bone deformation. We believe this process results in a mechanism of fibril-matrix decoupling for protecting the brittle mineral phase in bone, while effectively redistributing the strain energy within the bone tissue.


Conflict of interest statement

The authors declare no conflict of interest.

Figures

Fig. 1.
Fig. 1.
Change in tissue, fibril, and mineral particle strain in bone with applied stress. (Upper) Ratio of fibril strain to tissue strain (εFT) and mineral strain to tissue strain (εMT), averaged over n = 29 samples. Solid lines are guides to the eye, showing the expected constant strain ratio before yield. Dashed lines show how the ratio would vary if the fibril and mineral strains remain constant beyond the yield point, marked with the vertical dashed line. Error bars are standard errors of the mean. (Lower) Typical stress–strain curve of bovine fibrolamellar bone packet, showing an initial elastic increase followed by a reduced slope beyond the elastic/inelastic transition at εTY = 0.91%. The schematic on the right illustrates the different hierarchical length scales at which strain is being measured simultaneously (tissue, fibril, and mineral nanoparticle).
Fig. 2.
Fig. 2.
Correlation between mineral and fibril strain. Fibril and mineral strain are first binned in regular intervals of tissue strain, and then plotted versus each other. Open squares: wet, n = 29 samples, and filled circles: dry, n = 7 samples. Straight lines give linear regressions on the two data sets, and regression slopes give the mineral particle strain fraction in the enclosing fibril. Mineral particles take up a lower strain fraction in the fibrils when the tissue is wet. Slope for wet samples = 0.34 ± 0.15 and for dry samples = 0.53 ± 0.04. Error bars in the graph are standard errors of mean.
Fig. 3.
Fig. 3.
Mineral strain ratio as a function of sample elastic modulus. The average mineral strain ratio 〈εMT〉 is plotted, per sample, versus the elastic modulus ET. Open squares: wet, n = 29 samples and filled circles: dry, n = 7 samples. Lines show the expected nonlinear correlation between mineral strain fraction 〈εMT〉 and elastic modulus ET when stresses are transferred within and between the mineralized fibrils in a hierarchical staggered arrangement (see Fig. 4 and Eq. 1). Solid, wet collagen; dashed, dry collagen.
Fig. 4.
Fig. 4.
Schematic model for bone deformation in response to external tensile load at three levels in the structural hierarchy: at the tissue level (Left), fibril array level (Center), and mineralized collagen fibrils (Right). (Center) The stiff mineralized fibrils deform in tension and transfer the stress between adjacent fibrils by shearing in the thin layers of extrafibrillar matrix (white dotted lines show direction of shear in the extrafibrillar matrix). The fibrils are covered with extrafibrillar mineral particles, shown only over a selected part of the fibrils (red hexagons) so as not to obscure the internal structure of the mineralized fibril. (Right) Within each mineralized fibril, the stiff mineral platelets deform in tension and transfer the stress between adjacent platelets by shearing in the interparticle collagen matrix (red dashed lines indicate shearing qualitatively and do not imply homogeneous deformation).
Fig. 5.
Fig. 5.
Sample preparation setup. (a) Appearance of 50- to 100-μm-thick and ≈1-cm-wide fibrolamellar bone sheets (Left) after sectioning from pie-shaped sectors of bovine femoral bone (Right). L (longitudinal, parallel to bone long axis), R (radial, from center of bone to periosteum), and T (tangential to bone surface) denote the approximate coordinate system used. (b) A UV laser (1–2 μm diameter at focus) is rastered repeatedly (up to 10 times) over the bone sheets in the form of the elongated sample shape, until the sample is separated from the surrounding tissue, and can be removed. (c) (Left) A typical sample lying next to the source sheet from which it was taken. (Right) Schematic of sample mounted on plastic grips with cyanoacrylate glue.
Fig. 6.
Fig. 6.
In-beam microtensile schematic: Microtensile setup is inclined to the direct X-ray beam at 1/2 (2θ[0002]) ≈ 8.3° [where 2θ[0002] is the Bragg angle for (0002) hydroxyapatite c-axis reflection at λ = 0.0995 nm] to ensure that the strain from only the crystallites with c-axis along the tensile axis of the sample is measured. Sample is kept wet by enclosing within cellophane slips containing a water drop (Inset B). Tissue strain εT is determined by tracking marker lines (Inset A) in images taken by a CCD camera (not shown). SAXS and WAXD 2D images are recorded simultaneously by the FRELON 2000 CCD and Princeton Instruments CCD detectors respectively. The integrated diode on the beamstop is used for intensity normalization.

References

    1. Weiner S, Wagner HD. Annu Rev Mater Sci. 1998;28:271–298.
    1. Currey JD. Science. 2005;309:253–254. - PubMed
    1. Fratzl P, Gupta HS, Paschalis EP, Roschger P. J Mater Chem. 2004;14:2115–2123.
    1. Hassenkam T, Fantner GE, Cutroni JA, Weaver JC, Morse DE, Hansma PK. Bone. 2004;35:4–10. - PubMed
    1. Jager I, Fratzl P. Biophys J. 2000;79:1737–1746. - PMC - PubMed

Publication types