

A mechanism-based binding model for the population pharmacokinetics and pharmacodynamics of omalizumab
- PMID: 17096680
- PMCID: PMC2000760
- DOI: 10.1111/j.1365-2125.2006.02803.x
A mechanism-based binding model for the population pharmacokinetics and pharmacodynamics of omalizumab
Abstract
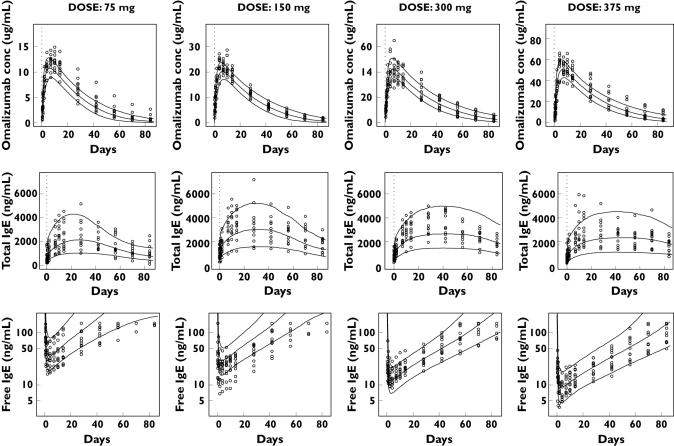
Aim: Omalizumab, a humanized IgG monoclonal antibody that binds to human immunoglobulin E (IgE), interrupts the allergic cascade in asthmatic patients. The aim was to compare simultaneously drug exposure and IgE biomarker responses in Japanese and White patient populations.
Methods: An instantaneous equilibrium drug-ligand binding and turnover population model was built from 202 Japanese patients. A posterior predictive evaluation for the steady-state distributions of omalizumab and IgE was then carried out against 531 White patients.
Results: The mean parameters estimated from the Japanese patients were as follows: omalizumab clearance 7.32 +/- 0.153 ml h(-1), IgE clearance 71.0 +/- 4.68 ml h(-1) and the difference between that for omalizumab and the complex 5.86 +/- 0.920 ml h(-1), the volume of distribution for omalizumab and IgE 5900 +/- 107 ml, and that for the complex 3630 +/- 223 ml, the rate of IgE production 30.3 +/- 2.04 microg h(-1). Half-lives of IgG (23 days) and IgE (2.4 days) were close to previous reports. The dissociation constant for binding, 1.07 nM, was similar to in vitro values. Clearance and volume of distribution for omalizumab varied with bodyweight, whereas the clearance and rate of production of IgE were predicted accurately by baseline IgE. Overall, these covariates explained much of the interindividual variability.
Conclusions: The predictiveness of the Japanese model was confirmed by Monte-Carlo simulations for a White population, also providing evidence that the pharmacokinetics of omalizumab and IgE were similar in these two populations. Furthermore, the model enabled the estimation of not only omalizumab disposition parameters, but also the binding with and the rate of production, distribution and elimination of its target, IgE.
Figures


References
-
- Ishizaka K, Ishizaka T. Identification of gamma IgE antibodies as a carrier of reaginic activity. J Immunol. 1967;99:1187–98. - PubMed
-
- Presta LG, Lahr SJ, Shields RL, Porter JP, Gorman CM, Fendly BM, Jardieu PM. Humanization of an antibody directed against IgE. J Immunol. 1993;151:2623–32. - PubMed
-
- Jardieu P. Anti IgE therapy. Curr Opin Immunol. 1995;7:779–82. - PubMed
Publication types
MeSH terms
Substances
LinkOut - more resources
Full Text Sources
Other Literature Sources
