Review
. 2007 Jan;113(1):88-120.
doi: 10.1016/j.pharmthera.2006.07.004. Epub 2006 Nov 13.

The role of intracellular signaling in insulin-mediated regulation of drug metabolizing enzyme gene and protein expression

Affiliations
Review

The role of intracellular signaling in insulin-mediated regulation of drug metabolizing enzyme gene and protein expression

Sang K Kim et al. Pharmacol Ther. 2007 Jan.

Abstract

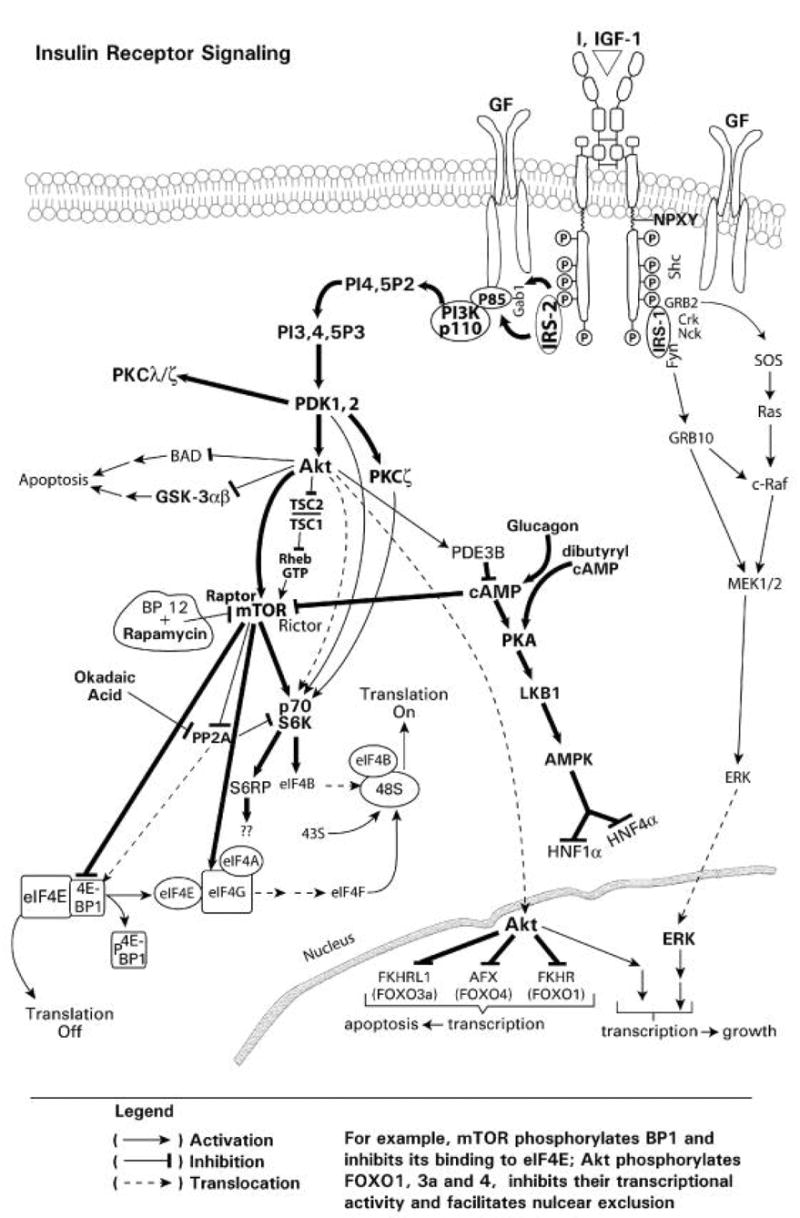
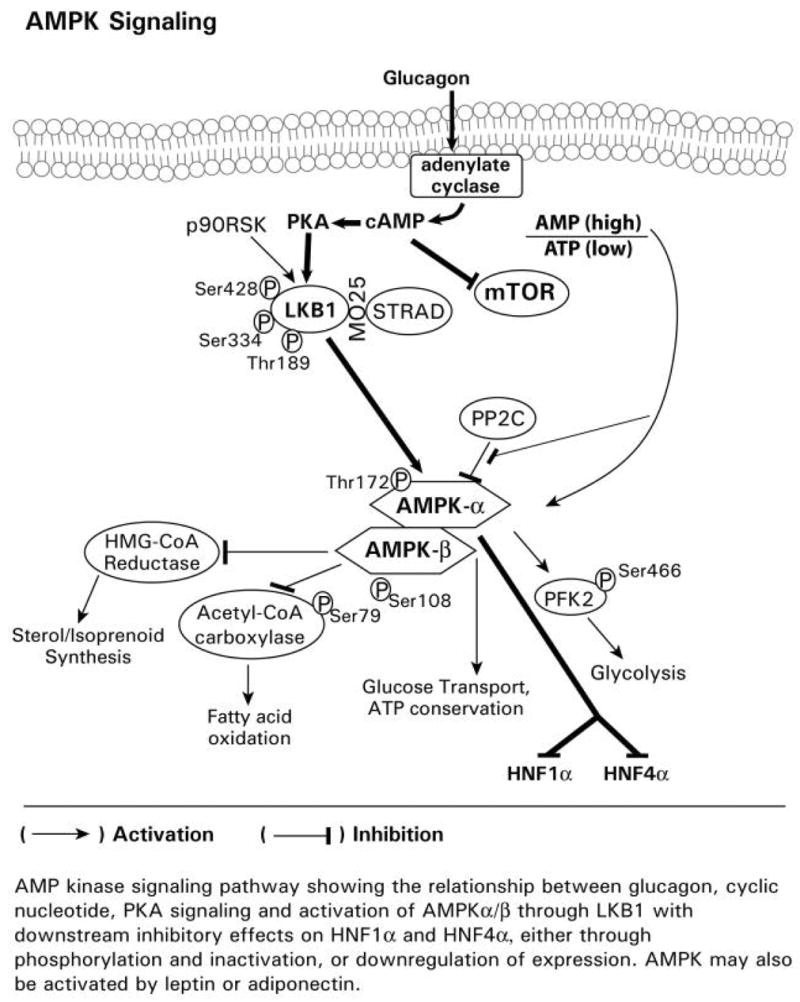
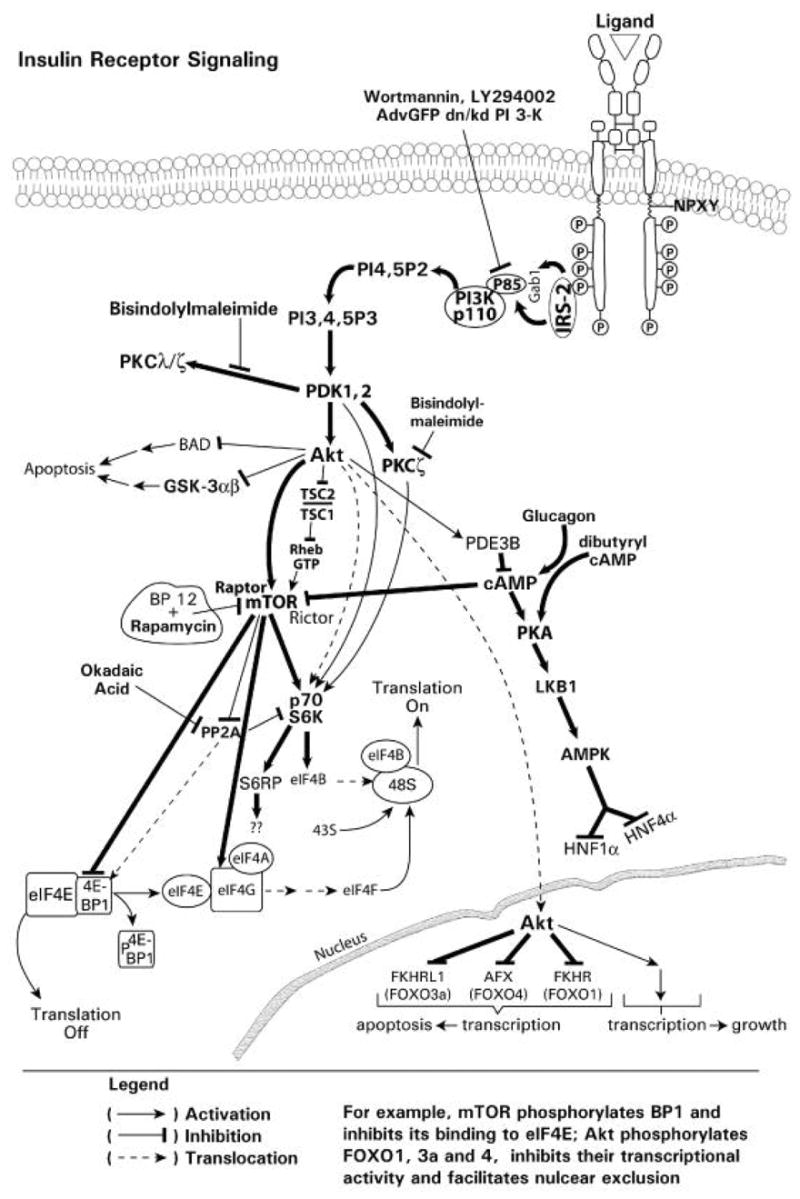
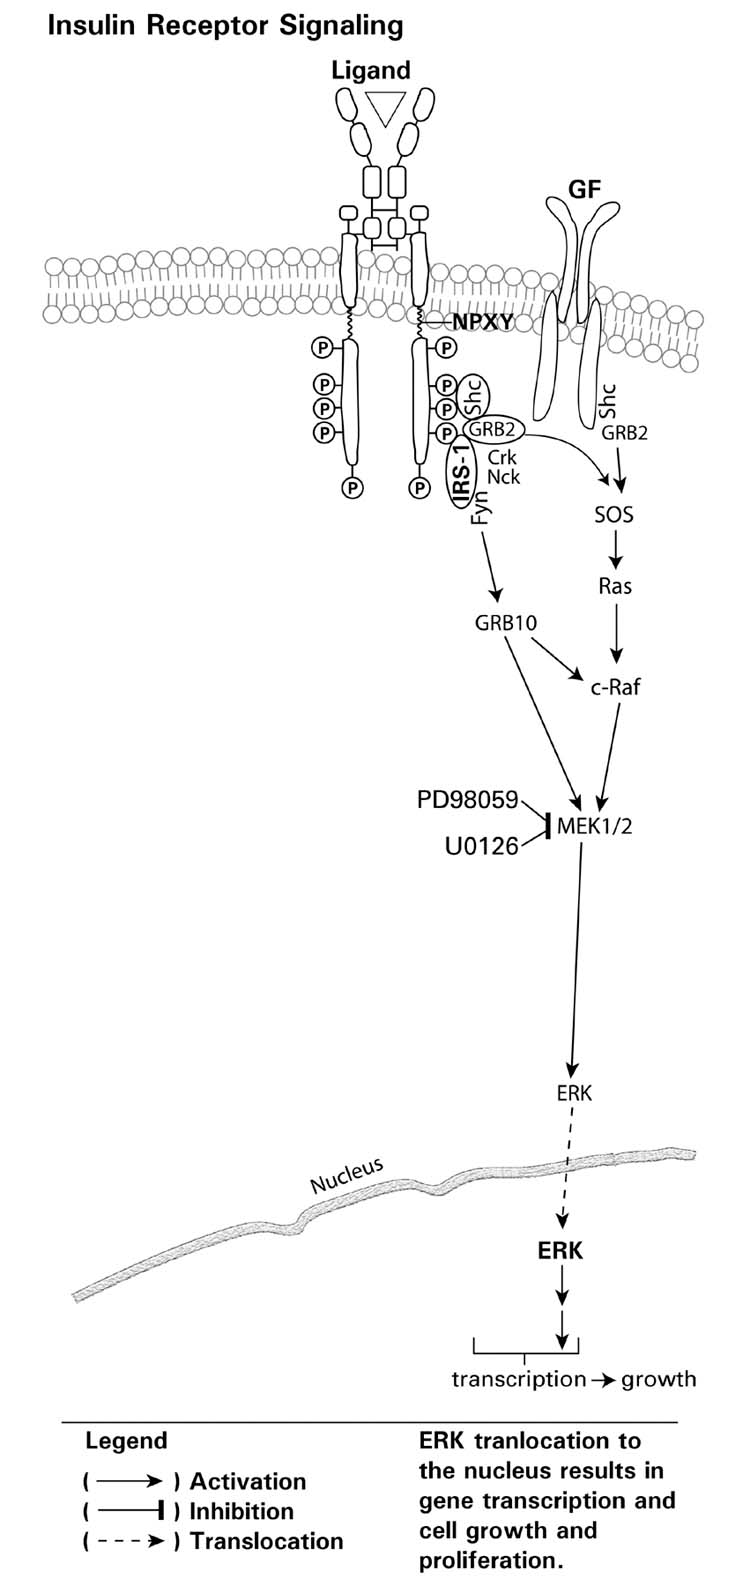
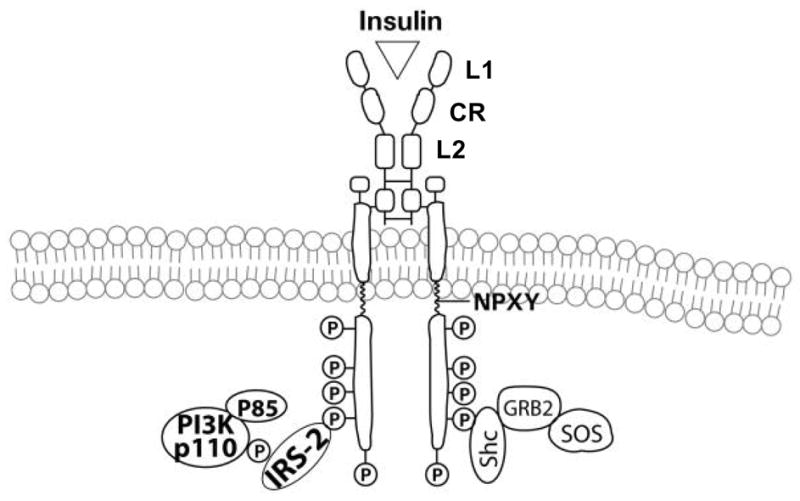
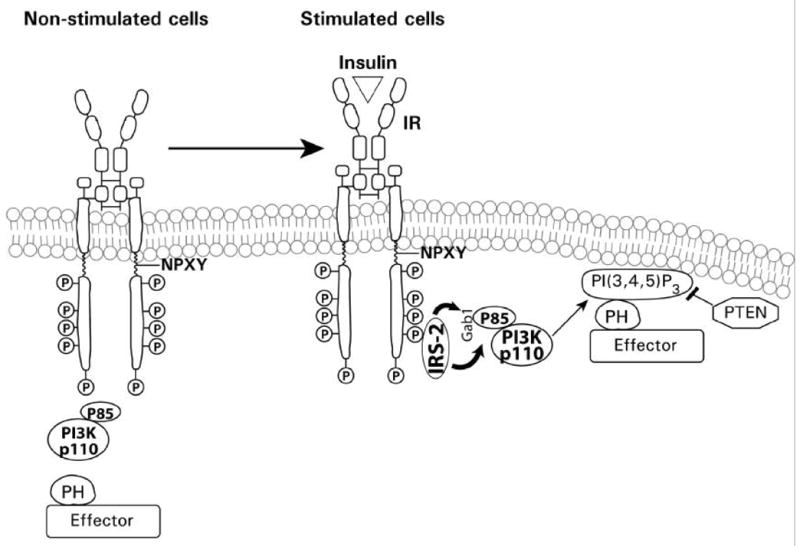
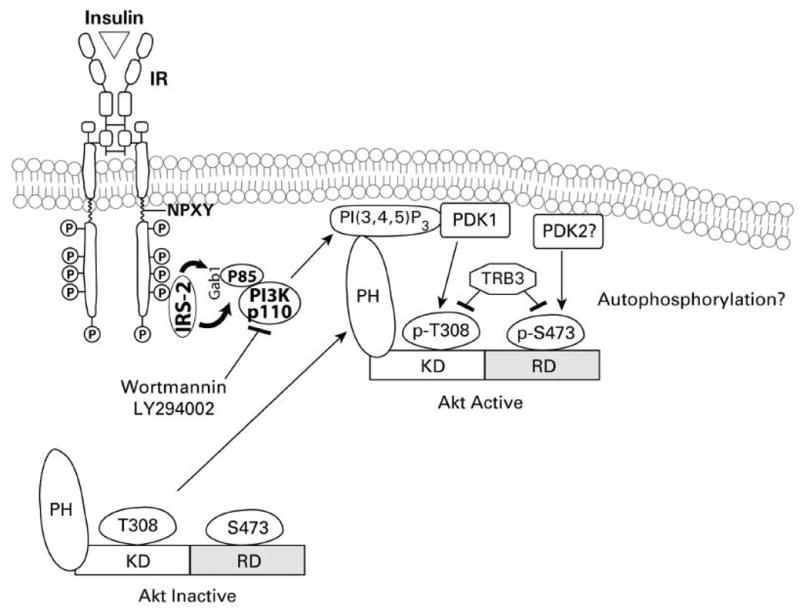
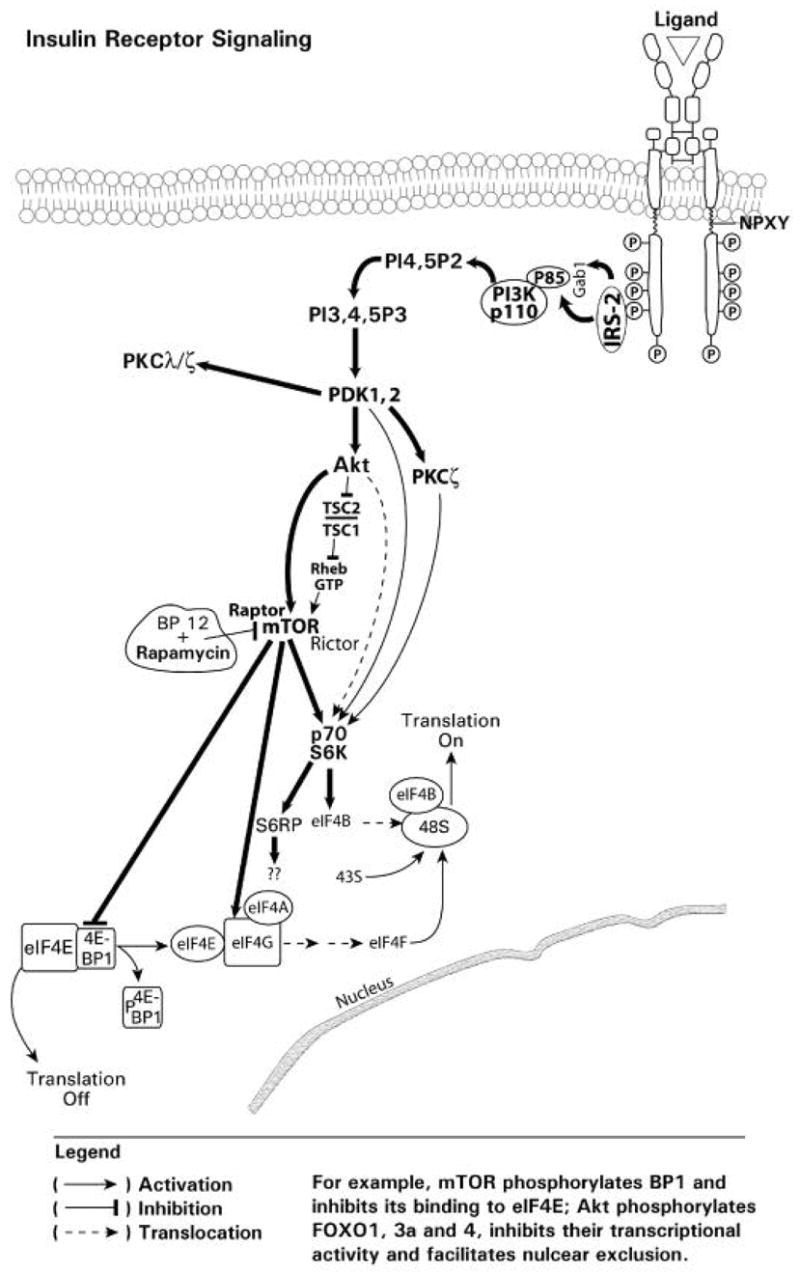
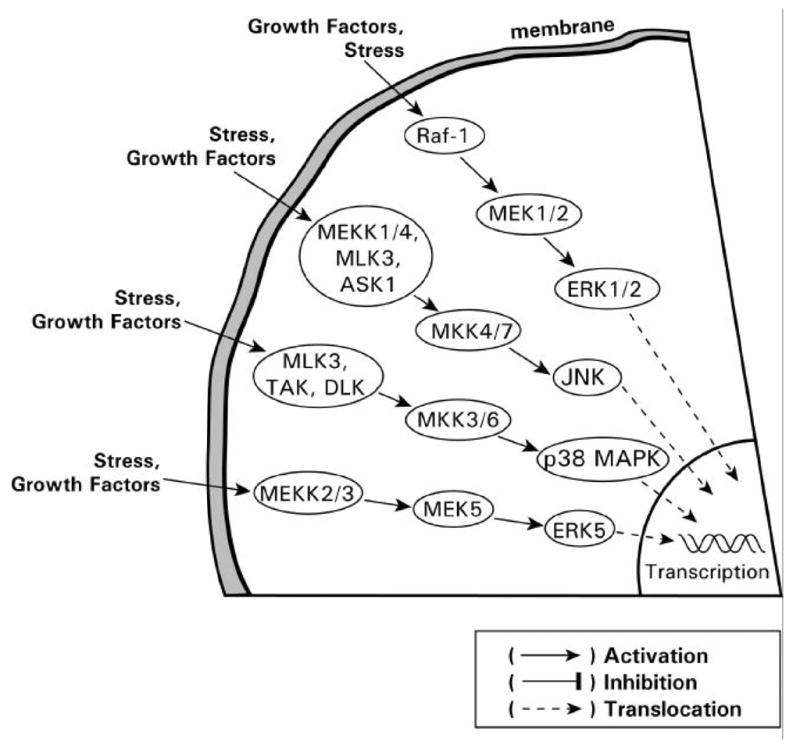
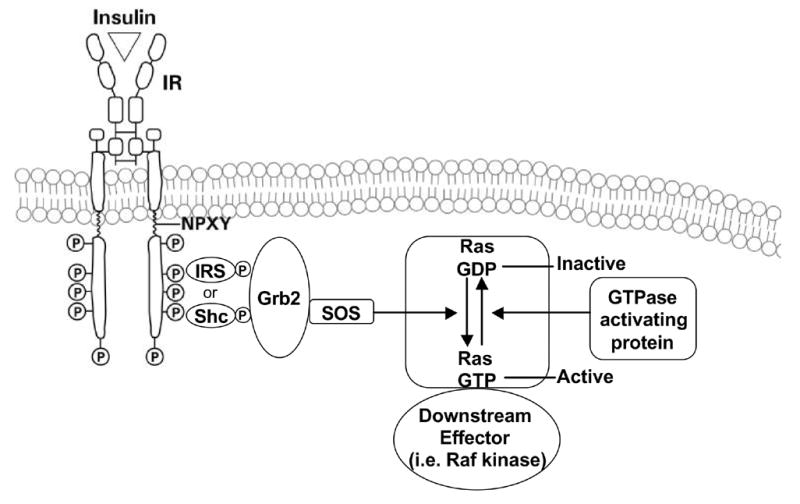
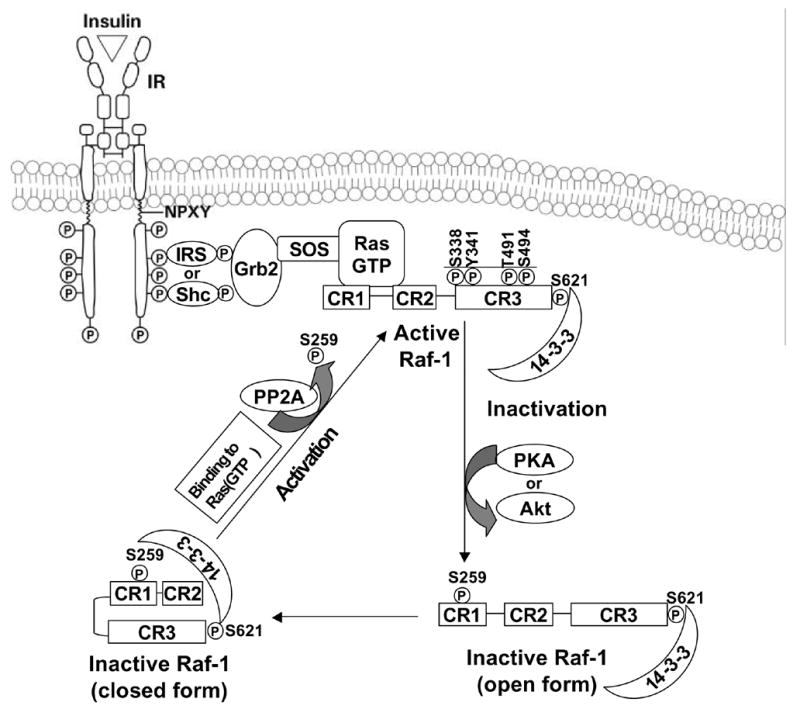
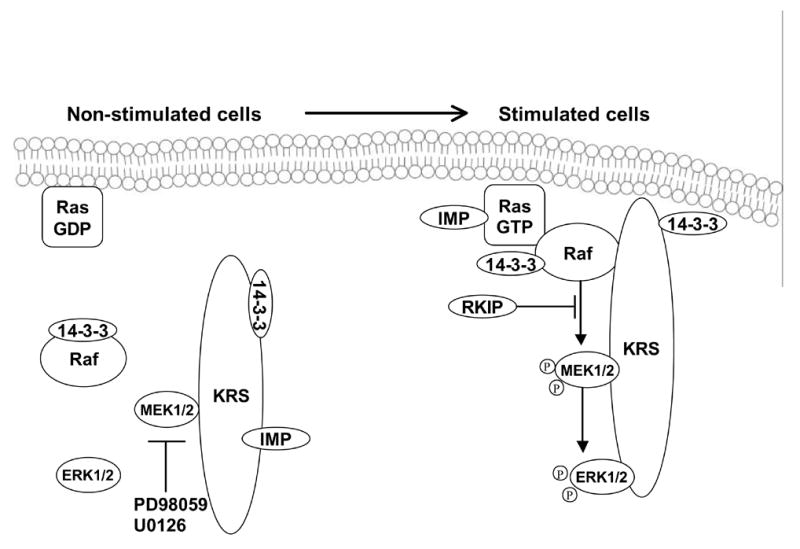
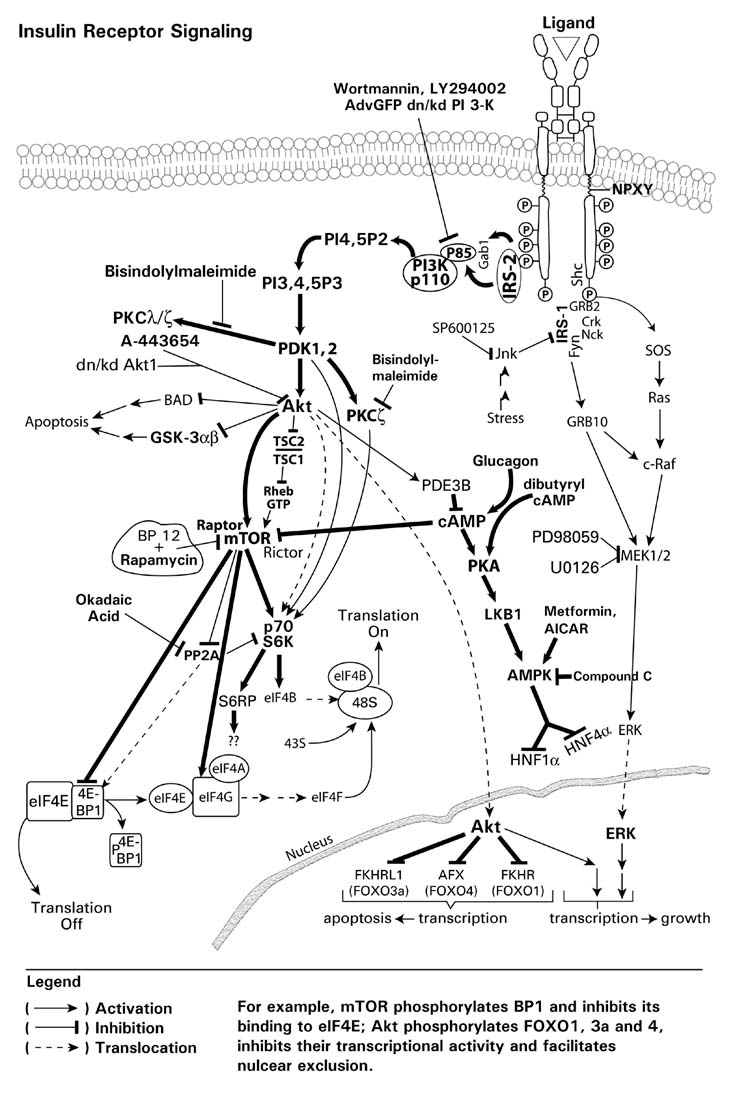
Endogenous factors, including hormones, growth factors and cytokines, play an important role in the regulation of hepatic drug metabolizing enzyme expression in both physiological and pathophysiological conditions. Diabetes, fasting, obesity, protein-calorie malnutrition and long-term alcohol consumption produce changes in hepatic drug metabolizing enzyme gene and protein expression. This difference in expression alters the metabolism of xenobiotics, including procarcinogens, carcinogens, toxicants and therapeutic agents, potentially impacting the efficacy and safety of therapeutic agents, and/or resulting in drug-drug interactions. Although the mechanisms by which xenobiotics regulate drug metabolizing enzymes have been studied intensively, less is known regarding the cellular signaling pathways and components which regulate drug metabolizing enzyme gene and protein expression in response to hormones and cytokines. Recent findings, however, have revealed that several cellular signaling pathways are involved in hormone- and growth factor-mediated regulation of drug metabolizing enzymes. Our laboratory has reported that insulin and growth factors regulate drug metabolizing enzyme gene and protein expression, including cytochromes P450 (CYP), glutathione S-transferases (GST) and microsomal epoxide hydrolase (mEH), through receptors which are members of the large receptor tyrosine kinase (RTK) family, and by downstream effectors such as phosphatidylinositol 3-kinase, mitogen activated protein kinase (MAPK), Akt/protein kinase B (PKB), mammalian target of rapamycin (mTOR), and the p70 ribosomal protein S6 kinase (p70S6 kinase). Here, we review current knowledge of the signaling pathways implicated in regulation of drug metabolizing enzyme gene and protein expression in response to insulin and growth factors, with the goal of increasing our understanding of how disease affects these signaling pathways, components, and ultimately gene expression and translational control.


Figures

Fig. 1
Fig. 1
Fig. 1A Insulin-mediated signaling pathways. A diagrammatic representation of insulin and growth factor receptor mediated signaling with effects on gene transcription, through phosphorylation of the FOXO1, 3a and 4 transcription factors, and mRNA translation, through 4E-PB1, p70 S6 kinase, eIF4B, S6 ribosomal protein, and eIF4G. Fig. 1B Glucagon-mediated signaling pathways. A diagrammatic representation of glucagon mediated signaling through the adenylate cyclase, cAMP, PKA, AMPK pathway with inhibitory effects on mTOR and the transcription factors HNF1alpha and HNF4alpha. The opposing effects of glucagon on insulin-mediated alterations in gene expression may occur through glucagon repression of insulin signaling through mTOR, which is associated with activation of PKA, the phosphorylation of LKB1, and activation of AMPK. Glucagon also represses activation of the phosphorylation of 4E-B P1 and the p70S6 kinase.
Fig. 1
Fig. 1
Fig. 1A Insulin-mediated signaling pathways. A diagrammatic representation of insulin and growth factor receptor mediated signaling with effects on gene transcription, through phosphorylation of the FOXO1, 3a and 4 transcription factors, and mRNA translation, through 4E-PB1, p70 S6 kinase, eIF4B, S6 ribosomal protein, and eIF4G. Fig. 1B Glucagon-mediated signaling pathways. A diagrammatic representation of glucagon mediated signaling through the adenylate cyclase, cAMP, PKA, AMPK pathway with inhibitory effects on mTOR and the transcription factors HNF1alpha and HNF4alpha. The opposing effects of glucagon on insulin-mediated alterations in gene expression may occur through glucagon repression of insulin signaling through mTOR, which is associated with activation of PKA, the phosphorylation of LKB1, and activation of AMPK. Glucagon also represses activation of the phosphorylation of 4E-B P1 and the p70S6 kinase.
Fig. 2
Fig. 2
Insulin-mediated activation of PI3K signaling pathways. A diagrammatic representation of insulin/insulin receptor-mediated signaling through the PI3K, PDK1/2 and Akt signaling pathway showing downstream effects on gene transcription and mRNA translation.
Fig. 3
Fig. 3
A diagrammatic representation of insulin on growth factor signaling through the Ras-Raf, MEK-ERK signaling pathway with downstream effects on gene transcription through ERK translocation.
Fig. 4
Fig. 4
A diagrammatic representation of the insulin receptor, activation of the cytosolic kinase, with subsequent phosphorylation of the kinase domain and tail, followed by the recruitment of the insulin receptor substrate(s) (e.g. IRS-2) and PI3K.
Fig. 5
Fig. 5
Insulin receptor activation and recruitment. An illustration of insulin binding, insulin receptor activation, phosphorylation, recruitment of PI3K, production of PI(3,4,5)P3, and recruitment of Akt with potential inhibition of Akt by the tumor suppressor PTEN. PH refers to the Pleckstrin homology domain of Akt.
Fig. 6
Fig. 6
Akt recruitment and activation. This figure showes the process of insulin receptor activation, PI3K recruitment to the IRS, production of PI(3,4,5)P3, recruitment of Akt to the membrane and subsequent activation. PH refers to the Pleckstrin homology domain of Akt.
Fig. 7
Fig. 7
The role of Akt and mTOR in translational control. The activation of mTOR results in phosphorylation of 4E-BP1, release of 4E-BP1 from the eIF4E-BP1 complex and initiation of translaton through formation of the eIF4E/4G/4A complex. mTOR also activated the p70S6K with effects on translational machinery.
Fig. 8
Fig. 8
The MAPK family members. The different categories and factors which activate the members of the MAPK family.
Fig. 9
Fig. 9
Ras activation. Diagrammatic representation showing the recruitment of the guanine nucleotide exchanger SOS, and the exchange of GDP for GTP resulting in the activation of Ras.
Fig. 10
Fig. 10
Ras and Raf activation. The process for activation and recruitment of Raf kinase and subsequent inactivation by Akt or PKA.
Fig. 11
Fig. 11
Scaffold proteins involved in MAPK signaling pathways. A drawing showing the binding of MAPKs and 14-3-3 to the KRS scaffold protein and subsequent activation.
Fig. 12
Fig. 12
Insulin/growth factor receptor signaling pathways. An insulin-signlaing diagram showing the various inhibitors which may be used to examine the role of individual kinases in the signaling process.
Fig. 13
Fig. 13
CYP2E1 mRNA levels and phosphorylation status of immunoprecipitated insulin receptor in response to insulin. After the 4-hr plating period in the presence of 1 μmol/L insulin, hepatocytes were maintained in the absence of insulin for 48 hr. Hepatocytes were then treated for 24 hr with 0 to 1,000 nmol/L insulin. CYP2E1 mRNA levels were monitored by Northern blot analysis and band density normalized to 7S RNA. (A) CYP2E1 mRNA levels plotted as a percentage of the CYP2E1 mRNA level monitored in hepatocytes cultured in the absence of insulin. Data are means ± range of Northern blot band densities of 2 preparations of total RNA. (B) Northern blot of CYP2E1 mRNA levels in hepatocytes treated with 0 to 1,000 nmol/L insulin. (C) Phosphotyrosine immunoblot of phosphorylated insulin receptor in hepatocytes treated with 0 to 1,000 nmol/L insulin. Phosphorylated insulin receptor is indicated by an arrow. This band comigrated with insulin receptor as detected with anti-insulin receptor antibody. Insulin receptor levels were similar in all samples (data not shown). The identity of the additional phosphotyrosine cross-reactive band below the phosphorylated insulin receptor is unknown. Reprinted from Woodcroft, KJ, Hafner, MS and Novak, RF, Hepatology, 35, 263–273, 2002, with permission.
Fig. 14
Fig. 14
Effect of insulin on CYP2E1, CYP2B, and CYP3A mRNA turnover. After the 4-h plating period in the presence of 1 μM insulin, hepatocytes were maintained in the absence of insulin for 48 h. Hepatocytes were then treated for 12 h with either medium alone (,), 10 nM insulin (!), or wortmannin (10 μM) plus 10 nM insulin(7). Actinomycin D (10 μg/mL) was added to hepatocytes without change of medium, and total RNA was isolated at the times indicated. CYP2E1 (A), CYP2B (B), and CYP3A (C) mRNA levels were monitored by Northern blot analysis and band density normalized to 7 S RNA. mRNA levels are plotted as a fraction of time zero mRNA levels for each treatment. Data are means ± SEM of Northern blot densities of 3 preparations of total RNA. First-order decay rate constants were derived and used to calculate half-life values. Reprinted from Woodcroft, KJ, Hafner, MS and Novak, RF, Hepatology, 35, 263–273, 2002, with permission.
Fig. 15
Fig. 15
Effect of insulin on CYP2E1 gene transcription monitored by CYP2E1 hnRNA analysis. After the 4-hour plating period in the presence of 1μmol/L insulin, hepatocytes were maintained in the absence of insulin for 48 hours. Hepatocytes were then treated for 20 hours without medium change (UT, - Fresh Medium), with fresh medium alone (UT, + Fresh Medium), or with 10 nmol/L insulin in fresh medium (10 nmol/L Insulin). (A) Polymerase chain reaction products of CYP2E1 hnRNA and CYP2E1 internal standard. (B) CYP2E1 hnRNA levels plotted as hnRNA copy number, normalized to CYP2E1 internal standard band density. Data are mean ± range of hnRNA band densities from 2 preparations of total RNA. (C) Northern blot of CYP2E1 mRNA levels in identical samples used for hnRNA analysis. (D) CYP2E1 mRNA levels in C plotted as a percentage of the CYP2E1 mRNA level monitored in hepatocytes treated with fresh medium (UT, + Fresh Medium), normalized to 7S RNA band density. Reprinted from Woodcroft, KJ, Hafner, MS and Novak, RF, Hepatology, 35, 263–273, 2002, with permission.
Fig. 16
Fig. 16
The effect of acetoacetate (AA) on CYP2E1 gene transcription. Hepatocytes were treated with PI3K inhibitors, LY294002 (LY) (10–20 μM) or wortmannin (Wort) (100–500 nM), or the PKC inhibitor, bisindolylmaleimide (Bis) (10 μM), for 1.5 h before treatment for 24 h with 5 mM AA. Untreated hepatocytes (UT) were cultured in the absence of AA, PI-3K inhibitors, and the PKC inhibitor. CYP2E1 gene transcription was monitored by hnRNA analysis and band density normalized to the 370bp CYP2E1 internal standard. CYP2E1 hnRNA levels are plotted as a percentage of the CYP2E1 hnRNA levels monitored in untreated hepatocytes. Data are means ± SEM of band densities of 2 or 3 preparations of total RNA *Significantly different from UT, ** significantly different from hepatocytes treated with AA only (p < 0.05). Reprinted from Abdelmegeed MA, Carruthers NJ, Woodcroft KJ, Kim SK and Novak RF, J Pharmacol Exp Ther. 315, 203–213, 2005, with permission.
Fig. 17
Fig. 17
Effect of dn/kd Akt expression on insulin-mediated increased in GSTA1/2, GSTA3/5 and GST activity in primary cultured rat hepatocytes. A, hepatocytes were infected with 30 or 150 MOI AdVGFP-Akt and 24 h later cells were harvested for determination of Akt protein level. B, C and D, 24 h after infection with 150 MOI AdVGFP dn/kd Akt or AdV-GFP, hepatocytes were treated with 10 nM insulin for 2 days. Data are means ± SD of 3–4 preparations of cell lysates from a single hepatocyte preparation. **,*** Significantly different than levels monitored in corresponding control hepatocytes, p<0.01 or p<0.001, respectively. Reprinted from Kim SK, Abdelmegeed MA and Novak RF, J Pharmacol Exp Ther. 316, 1255–1261, 2006, with permission.
Fig. 18
Fig. 18
Insulin effect on GCLC protein (A), GCLC mRNA (B), GCL activity (C), and GSH (D) levels in primary cultured rat hepatocytes. Hepatocytes were maintained in the presence or absence of 100 nM insulin for 1 to 4 days. GCLC protein and mRNA levels are plotted as a percentage of the level monitored in freshly isolated hepatocytes (0 day, 100%). Data are means ± SD of three to five preparations of cell lysates from a single hepatocyte preparation. **,***, significantly different from levels monitored in corresponding hepatocytes maintained in the absence of insulin, p < 0.01 or p < 0.001, respectively. Reprinted from Kim SK, Woodcroft KJ, Khodadadeh SS and Novak RF, J Pharmacol Exp Ther. 311, 99–108, 2004, with permission.
Fig. 19
Fig. 19
Effect of AdvGFP dn/kd Akt expression on insulin-mediated GCLC protein and GSH levels in primary cultured rat hepatocytes. A, hepatocytes were infected with 150 MOI AdVGFP dn/kd Akt1 or 15 MOI AdV-GFP, and cells were harvested 24 h later for determination of Akt protein levels. B, following 24-h infection with AdV-Akt or AdV-GFP, hepatocytes were treated with 10 nM insulin for 30 min and assayed for Akt activity by maintaining the Akt-mediated phosphorylation of GSKα/β. C and D, 24 h after infection with AdV-Akt or AdV-GFP hepatocytes were treated with 10 nM insulin for 2 days. The AdvGFP dn/kd Akt infection diminished the insulin-mediated increase in GCLC protein as compared to controls (no AdvGFP treatment or treatment with the AdvGFP vector alone). Cellular GSH levels were also decreased in response to the dn/kd Akt infection. Data are means ± S.D. of three and four preparations of cell lysates from a single hepatocyte preparation. Values with different letters are significantly different from each other, p < 0.05. Reprinted from Kim SK, Woodcroft KJ, Khodadadeh SS and Novak RF, J Pharmacol Exp Ther. 311, 99–108, 2004, with permission.

Similar articles

Cited by

References

    1. Abdelmegeed MA, Carruthers NJ, Kim SK, Woodcroft KJ, Novak RF. Acetoacetate induces cytochrome P450 (CYP) 2E1 protein and suppresses CYP2E1 gene transcription in primary cultured rat hepatocytes. J Pharmacol Exp Ther. 2005;315:203–213. - PubMed
    1. Abernethy DR, Greenblatt DJ, Divoll M, Shader RI. Enhanced glucuronide conjugation of drugs in obesity: studies of lorazepam, oxazepam, and acetaminophen. J Lab Clin Med. 1983;101:873–880. - PubMed
    1. Agius C, Gidari AS. Effect of streptozotocin on the glutathione S-transferases of mouse liver cytosol. Biochem Pharmacol. 1985;34:811–819. - PubMed
    1. Alemzadeh R, Tushaus KM. Modulation of adipoinsular axis in prediabetic zucker diabetic fatty rats by diazoxide. Endocrinology. 2004;145:5476–84. - PubMed
    1. Alessi DR, Cuenda A, Cohen P, Dudley DT, Saltiel AR. PD 098059 is a specific inhibitor of the activation of mitogen-activated protein kinase kinase in vitro and in vivo. J Biol Chem. 1995;270:27489–27494. - PubMed

Publication types

MeSH terms