. 2006 Nov;10(5):401-11.
doi: 10.1016/j.ccr.2006.09.012.

Tribbles homolog 2 inactivates C/EBPalpha and causes acute myelogenous leukemia

Affiliations

Tribbles homolog 2 inactivates C/EBPalpha and causes acute myelogenous leukemia

Karen Keeshan et al. Cancer Cell. 2006 Nov.

Abstract

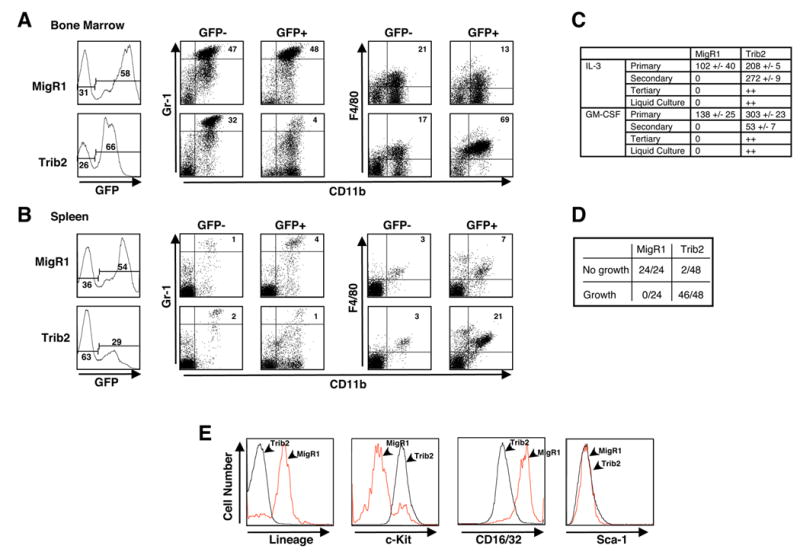
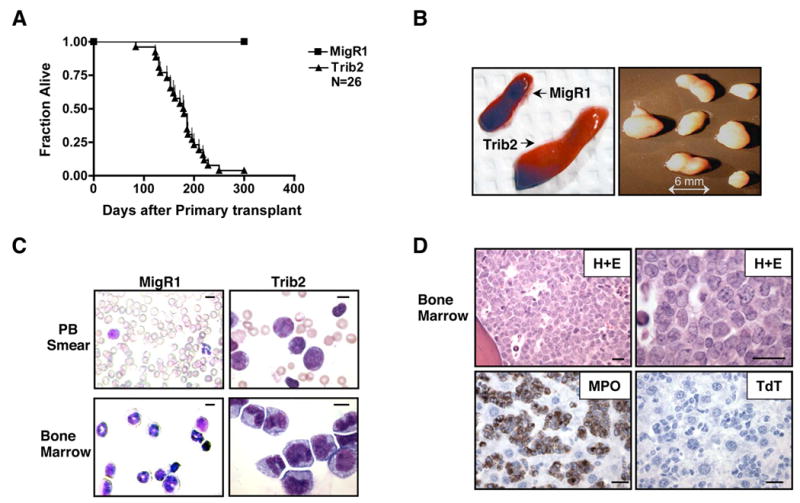
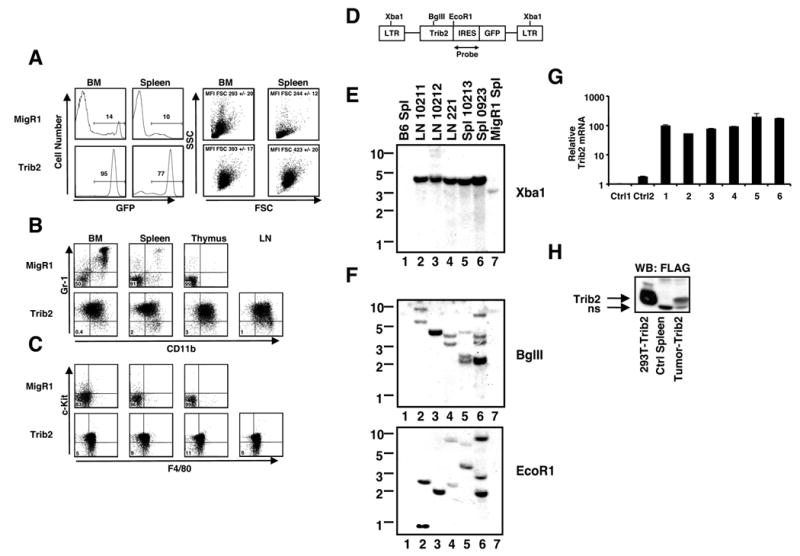
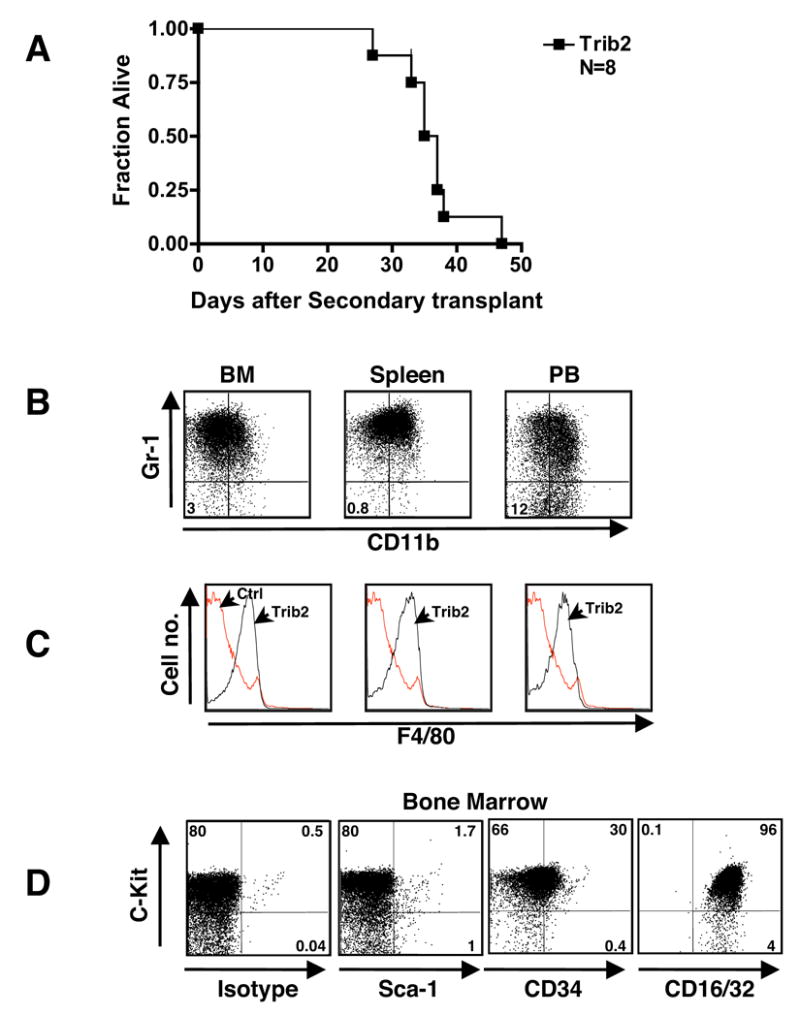
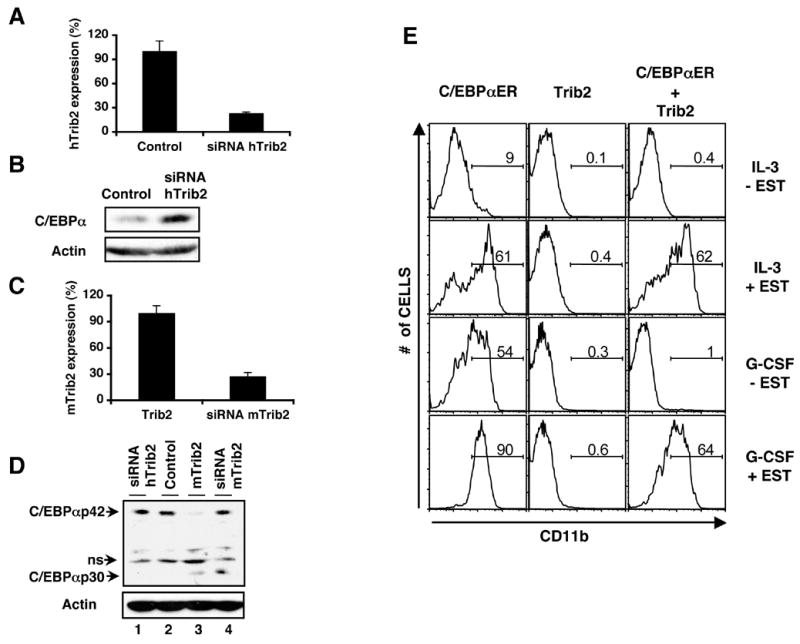
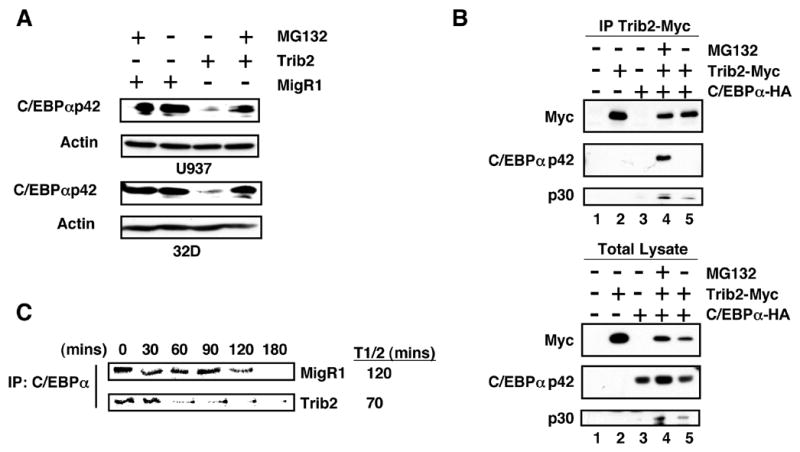
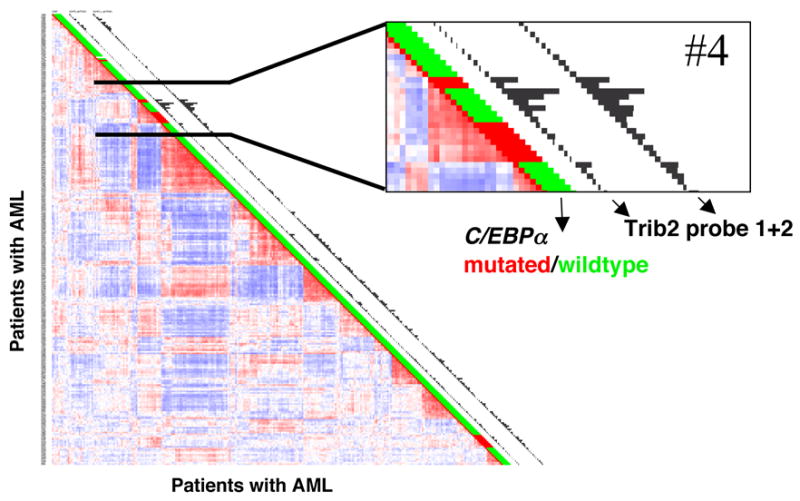
Tribbles homolog 2 (Trib2) was identified as a downregulated transcript in leukemic cells undergoing growth arrest. To investigate the effects of Trib2 in hematopoietic progenitors, mice were reconstituted with hematopoietic stem cells retrovirally expressing Trib2. Trib2-transduced bone marrow cells exhibited a growth advantage ex vivo and readily established factor-dependent cell lines. In vivo, Trib2-reconstituted mice uniformly developed fatal transplantable acute myelogenous leukemia (AML). In mechanistic studies, we found that Trib2 associated with and inhibited C/EBPalpha. Furthermore, Trib2 expression was elevated in a subset of human AML patient samples. Together, our data identify Trib2 as an oncogene that induces AML through a mechanism involving inactivation of C/EBPalpha.


Figures

Figure 1
Figure 1. Trib2 perturbs myeloid development in vivo and promotes self-renewal in vitro
B6 mice were lethally irradiated and reconstituted with BM cells transduced with control MigR1 vector or Trib2. Flow cytometric analysis of MigR1 and Trib2 chimeric mice at 9–14 weeks post BMT. (A) BM and (B) spleen showing GFP positivity and Gr-1hiCD11b+ neutrophils (percentages given) in the GFP+ and GFP fractions (left panel). In the right panel, F4/80+CD11b+ monocytes (percentages given) in the GFP+ and GFP fractions are shown. Results are representative of 3 independent experiments using 6 mice. (C) GFP+ BM cells (25,000) sorted from MigR1 and Trib2 chimeric mice at week 9 post-BMT were plated in methylcellulose in the presence of the indicated cytokines. Colonies with >50 cells were scored after primary plating (9 days), secondary replating (15,000 cells, 10 days), tertiary replating (15,000 cells, 8 days), and growth in liquid culture (8 days) in triplicate. The mean numbers of colonies, +/− S.E.M, for each condition are tabulated. “++” indicates colony growth or growth in liquid culture. (D) 5,000 sorted GFP+, lin BM cells from Trib2 and MigR1 chimeras were plated in triplicate in methylcellulose containing IL-3, IL-6, SCF and GM-CSF. Single colonies from primary MigR1 and Trib2 plates at day 9 were replated in liquid culture plus cytokines (IL-3, IL-6, SCF) in 24 well plates and assessed for growth after 11 days (growth = cell expansion and yellow media). (E) FACS analysis of MigR1 and Trib2 cells from a representative liquid culture in (D).
Figure 2
Figure 2. Trib2 induces AML
(A) Kaplan-Meier survival curve of mice receiving Trib2 transduced BM compared to MigR1 control. The median survival of Trib2 mice was 179 days. Results are derived from seven independent experiments. (B) Representative photographs of splenomegaly in Trib2 mice compared to control MigR1 spleen, and lymphadenopathy in Trib2 mice. (C) Wright-Giemsa stained PB and BM single cell suspensions from MigR1 and leukemic Trib2 mice. Scale bars (upper right) represent 10 μm. The percentage of GFP+ cells in Trib2 BM and spleen was approximately 90–100% and 65–80% respectively. (D) Histopathology of BM sections from Trib2-induced AML. Hematoxylin and eosin (H+E) section showing hypercellularity (top left) due to the presence of sheets of immature cells and blasts (top right). The tumor cells stain positively for myeloperoxidase (MPO, bottom left) and negatively for terminal deoxytransferase (TdT, bottom right). Scale bars (lower right) represent 20 μm.
Figure 3
Figure 3. Analysis of Trib2-induced AML
(A) Flow cytometric analysis of GFP expression (percentages given), forward scatter (FSC) and side scatter (SSC) in cells obtained from BM and spleens of leukemic mice. Mean Fluorescence Intensity (MFI) of FSC of the GFP+ cells are shown +/− S.D. (B–C) Immunophenotypes of primary Trib2-induced AML cells from lymph nodes (LN), thymus, spleen, and BM compared to control MigR1 cells. (B) Flow cytometric analysis of Gr-1 and CD11b expression and (C) c-Kit and F4/80 expression, in the GFP+ fraction of MigR1 (top) and Trib2 (bottom panels) mice. The percentages of cells Gr-1CD11b are shown in (B), and the percentages of cells c-Kit-F4/80 are shown in (C). Results are representative of 7 independent experiments. (D) Schematic of Trib2 provirus and probe used for Southern blotting. (E–F) Southern blot dectection of proviruses in Trib2 mice. DNA preparations were digested with (E) Xba1 to detect intact provirus (~4kb) and (F) BglII or EcoR1, which cleaved once in the provirus, to detect different proviral integrants. All leukemic samples were obtained from different primary mice; lanes 1 and 7 contain control DNAs from B6 mouse spleen (Spl) and MigR1 control spleen, respectively. (G) Real-time RT-PCR analysis of Trib2 expression in cDNAs from six primary Trib2-induced AML tumor spleen samples (1–6), using murine Trib2-specific primers. The results are presented as Trib2 mRNA in AML samples relative to expression in control MigR1 spleen cells (Ctrl1, Ctrl2), normalized for 18s rRNA content. Error bars denote +/− SD of each sample measured in triplicate. (H) Analysis of Trib2 protein expression by western blot. Extracts of primary Trib2-induced AML cells obtained from spleen (>90%GFP, MigR1-Trib2-FLAG) were compared to extracts prepared from control MigR1 spleen cells and 293T cells transfected with pcDNA-Trib2-FLAG. Trib2-FLAG polypeptides were detected on the blot with the FLAG antibody (M2, Sigma). ns=non-specific band.
Figure 4
Figure 4. Trib2-induced AML is 100% transplantable
(A) Kaplan-Meier survival curve of secondary transplants. Sublethally irradiated mice (600 rads) received 2 x 10⁶ BM or spleen cells from eight primary leukemic mice. (B–D) Immunophenotype of Trib2-induced AML after secondary transplant. Cells from BM, spleen and PB were assessed by flow cytometry. (B) The Gr-1 and CD11b profile of the GFP+ population is shown; percentages given are cells negative for both markers. (C) F4/80 profile of the GFP+ Trib2 cells (black line) are overlayed on the normal F4/80 staining profile of B6 control BM cells (red line). Results shown are representative of N=8 mice. (D) The c-Kit and isotype/Sca-1/CD34/CD16/32 profile of the GFP+ population is shown.
Figure 5
Figure 5. Trib2 reduces normal C/EBPα levels and inhibits its activity
(A) Sorted GFP+ 32D and U937 cells transduced with either MigR1 or Trib2 were assessed for C/EBPα protein expression by western blot. C/EBPαp42 is the full-length protein and C/EBPαp30 is the truncated protein. Actin is the protein loading control. (B) Analysis of C/EBPαp42 and p30 protein expression in primary leukemic samples from BM (93% GFP+), spleen (63% GFP+) and lymph node (88% GFP+) compared to normal levels expressed in CMPs and GMPs from B6 BM (left panel). Levels of C/EBPαp42 and p30 proteins were also compared in unfractionated normal B6 mouse BM cells and primary (94% GFP+) and secondary (98% GFP+) leukemic BM samples (right panel). (C) Schematic of the IL-12 promoter containing the C/EBPα binding site. (D) RAW264.7 macrophages were co-transfected with i) the IL-12 promoter firefly luciferase constructs containing the C/EBP WT or mutant binding sites, ii) either empty vector, Trib2, C/EBPα or both Trib2 and C/EBPα, and iii) a pRL-TK Renilla luciferase internal control plasmid. Luciferase activity was measured following LPS (100 ng/ml) treatment for 8 hrs, 24 hrs post-transfection. Reporter luciferase activity for each sample was normalized to the Renilla luciferase activity of the same sample. Data presented are mean +/− SD of triplicate cultures. (E) C/EBPα DNA binding activity was assessed by EMSA using a double-stranded oligonucleotide probe containing the C/EBP binding site from the human G-CSF receptor. Nuclear extracts from sorted GFP+ U937 cells transduced with MigR1 (lanes 1, 2), Trib2 (lanes 3, 4), or C/EBPα (lanes 5, 6), were incubated with 32P-labeled probe. In lanes 2, 4, and 6, 2 μL of C/EBPα antibody was added. SS indicates the supershifted C/EBPα complex. The extracts used in lanes 1, 3, and 5 were tested with an OCT-1 probe in a second EMSA assay as a control for the integrity and quantity of nuclear binding proteins.
Figure 6
Figure 6. Trib2-dependent inhibition of C/EBPα expression and function is abrogated by siRNA-mediated knockdown of Trib2 and over-expression of C/EBPα
(A–B) siRNA designed to knockdown human Trib2 (hTrib2) was electroporated into U937 cells and analyzed 24 hr later. (A) hTrib2 expression assessed by real-time RT-PCR. Error bars denote +/− S.E.M of each sample measured in triplicate. (B) Western blot of C/EBPα protein expression. Lane 1=negative control siRNA and lane 2=hTrib2 siRNA. C/EBPαp30 is undetectable in parental U937 cells. (C–D) siRNA designed to knockdown murine Trib2 (mTrib2) was electroporated into U937 cells retrovirally expressing murine Trib2 and analyzed 24 hr later. (C) mTrib2 expression assessed by real-time RT-PCR. Error bars denote +/− S.E.M of each sample measured in triplicate. (D) Western blot of C/EBPαp42 and C/EBPαp30 protein expression. Lanes 1 & 2=U937 cells + human Trib2 siRNA and negative control siRNA respectively as in (B); lanes 3 & 4=U937-mTrib2 cells + negative control siRNA and siRNA mTrib2 respectively. ns=non-specific band (E) 32D cells transduced with C/EBPαER (GFP)α Trib2 (tNGFR), or C/EBPαER+Trib□ were sorted for GFP and/or tNGFR expression. Sorted cells were plated in equal numbers (1x10⁵) (day 0, 48 hrs post-transduction) in IL-3 or G-CSF +/− 1μM β-estradiol (EST). CD11b expression was assessed after 2 days. Data are representative of 3 independent experiments.
Figure 7
Figure 7. Trib2 forms a complex with C/EBPα and results in its proteosomal-dependent degradation
(A) Sorted GFP+ U937 (top panel) and 32D (lower panel) cells transduced with either MigR1 or Trib2, treated +/− 10 μM MG132 for 2 hrs were assessed for C/EBPα expression by western blot. (B) 293T cells were transfected with empty vector (lane 1), myc-tagged Trib2 (lane 2), HA-tagged C/EBPα (lane 3), or co-transfected with both (lanes 4 and 5), and treated with 10 μM MG132 for 2 hrs (lane 4). Trib2 was immunoprecipitated using a Myc 9E10 antibody and western blotting performed with HA and Myc antibodies on immunoprecipitates (top panel) and total lysates (lower panel). (C) U937 cells transduced with MigR1 or Trib2 were metabolically labeled with 35S-methionine for 60 min and chased for the indicated times. C/EBPα was immunoprecipitated and radiolabeled protein detected by SDS-PAGE. The half-life (T1/2) was calculated using ImageJ software.
Figure 8
Figure 8. Trib2 is elevated in a subset of human AML
Correlation view of 285 AML patients (Valk et al. 2004). Colors of cells relate to Pearson’s correlation coefficient values, red indicates higher positive and blue indicates higher negative correlation between samples. Sixteen clusters represented by red blocks along the diagional can be identified. C/EBPα mutation status is indicated next to each tumor (red = mutant, green = wild type). Histograms next to each tumor represent expression levels of the two probe sets for Trib2. Cluster 4, one of the two clusters harboring most patients with C/EBPα mutations, has a significantly elevated expression of Trib2 relative to other clusters.

References

    1. Akashi K, Traver D, Miyamoto T, Weissman IL. A clonogenic common myeloid progenitor that gives rise to all myeloid lineages. Nature. 2000;404:193–197. - PubMed
    1. Baer M, Johnson PF. Generation of truncated C/EBPbeta isoforms by in vitro proteolysis. J Biol Chem. 2000;275:26582–26590. - PubMed
    1. Bisoffi M, Klima I, Gresko E, Durfee PN, Hines WC, Griffith JK, Studer UE, Thalmann GN. Expression profiles of androgen independent bone metastatic prostate cancer cells indicate up-regulation of the putative serine-threonine kinase GS3955. J Urol. 2004;172:1145–1150. - PubMed
    1. Bowers AJ, Scully S, Boylan JF. SKIP3, a novel Drosophila tribbles ortholog, is overexpressed in human tumors and is regulated by hypoxia. Oncogene. 2003;22:2823–2835. - PubMed
    1. Calkhoven CF, Muller C, Leutz A. Translational control of C/EBPalpha and C/EBPbeta isoform expression. Genes Dev. 2000;14:1920–1932. - PMC - PubMed

Publication types

MeSH terms

Substances