. 2007 Jan 1;457(1):111-22.
doi: 10.1016/j.abb.2006.09.010. Epub 2006 Oct 4.

Frataxin knockdown causes loss of cytoplasmic iron-sulfur cluster functions, redox alterations and induction of heme transcripts

Affiliations

Frataxin knockdown causes loss of cytoplasmic iron-sulfur cluster functions, redox alterations and induction of heme transcripts

Chunye Lu et al. Arch Biochem Biophys. .

Abstract

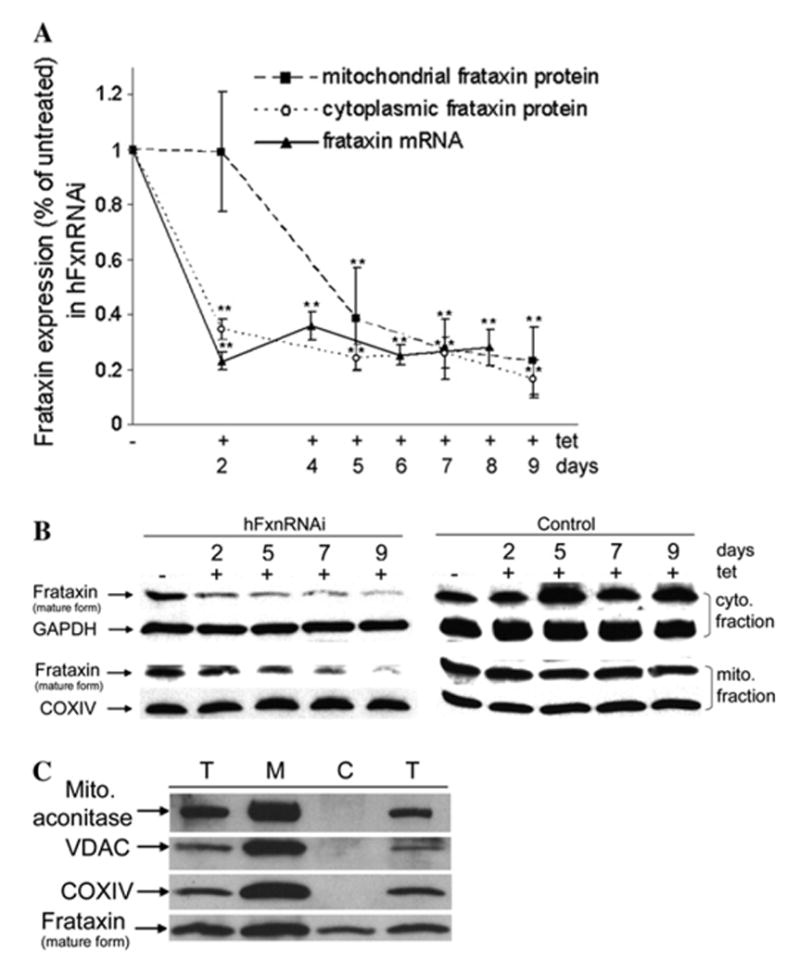
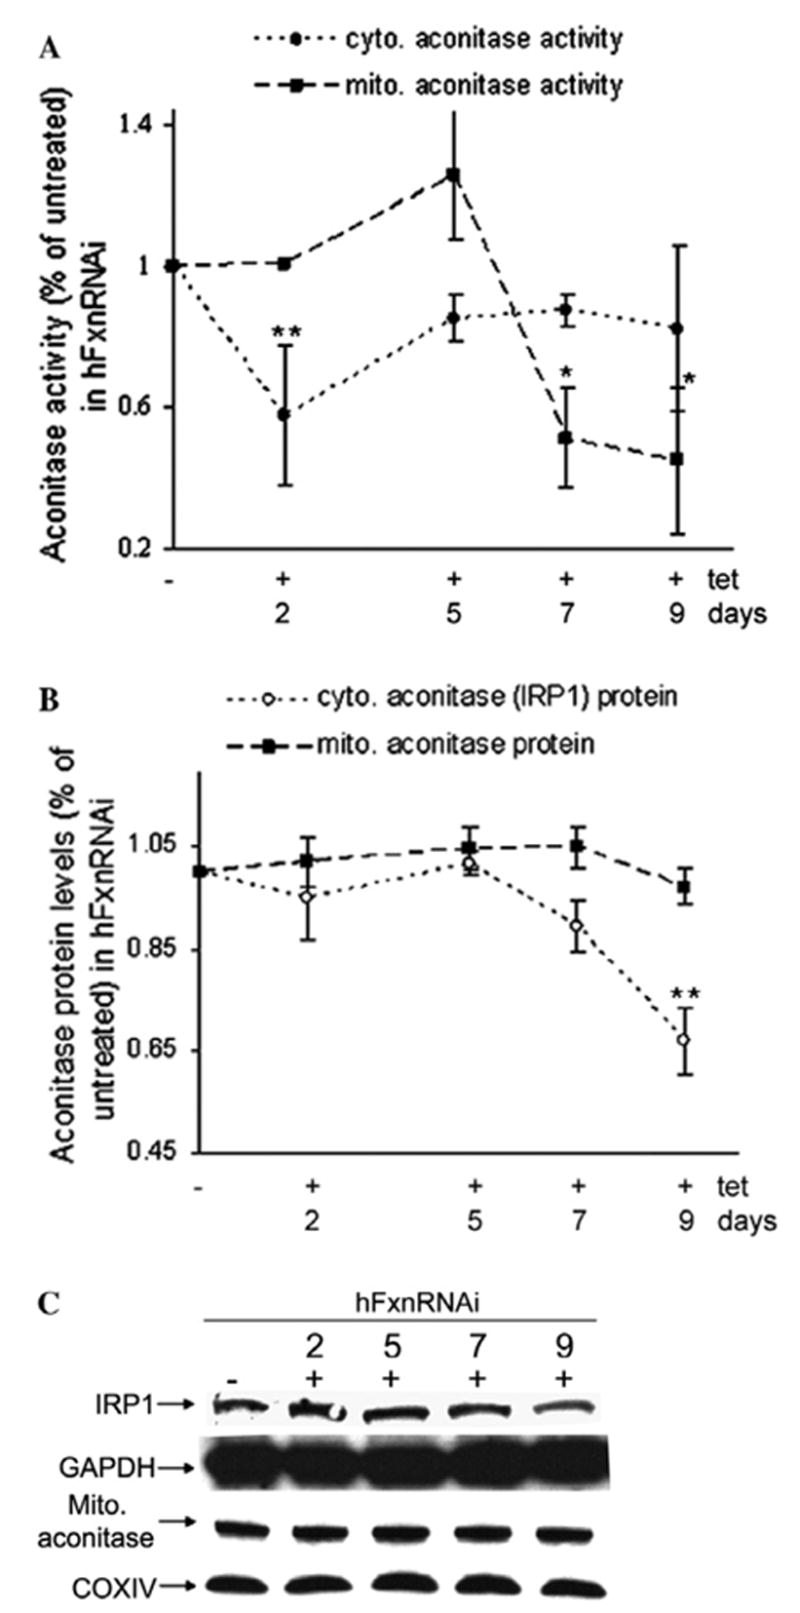
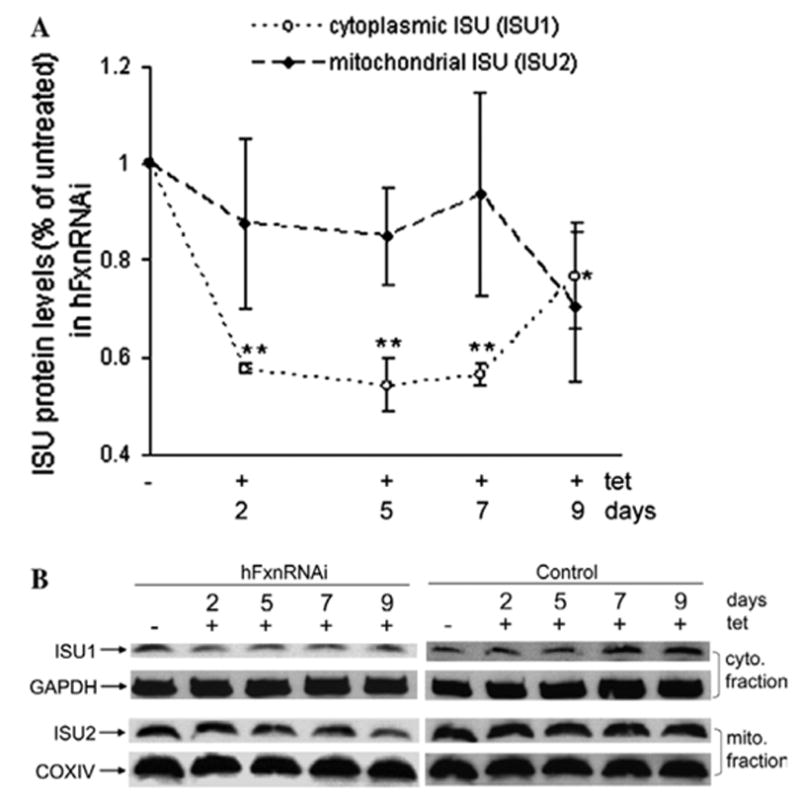
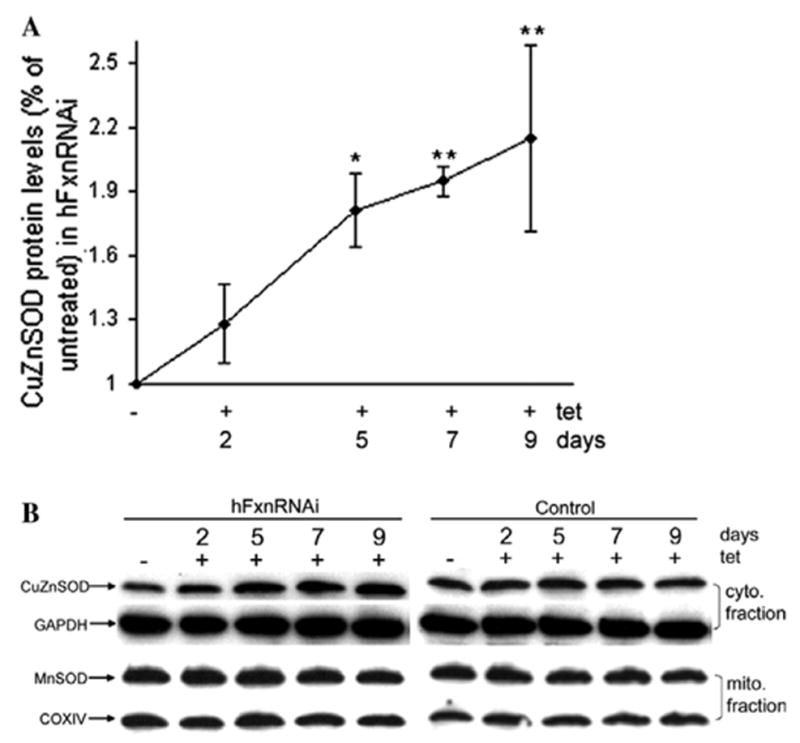
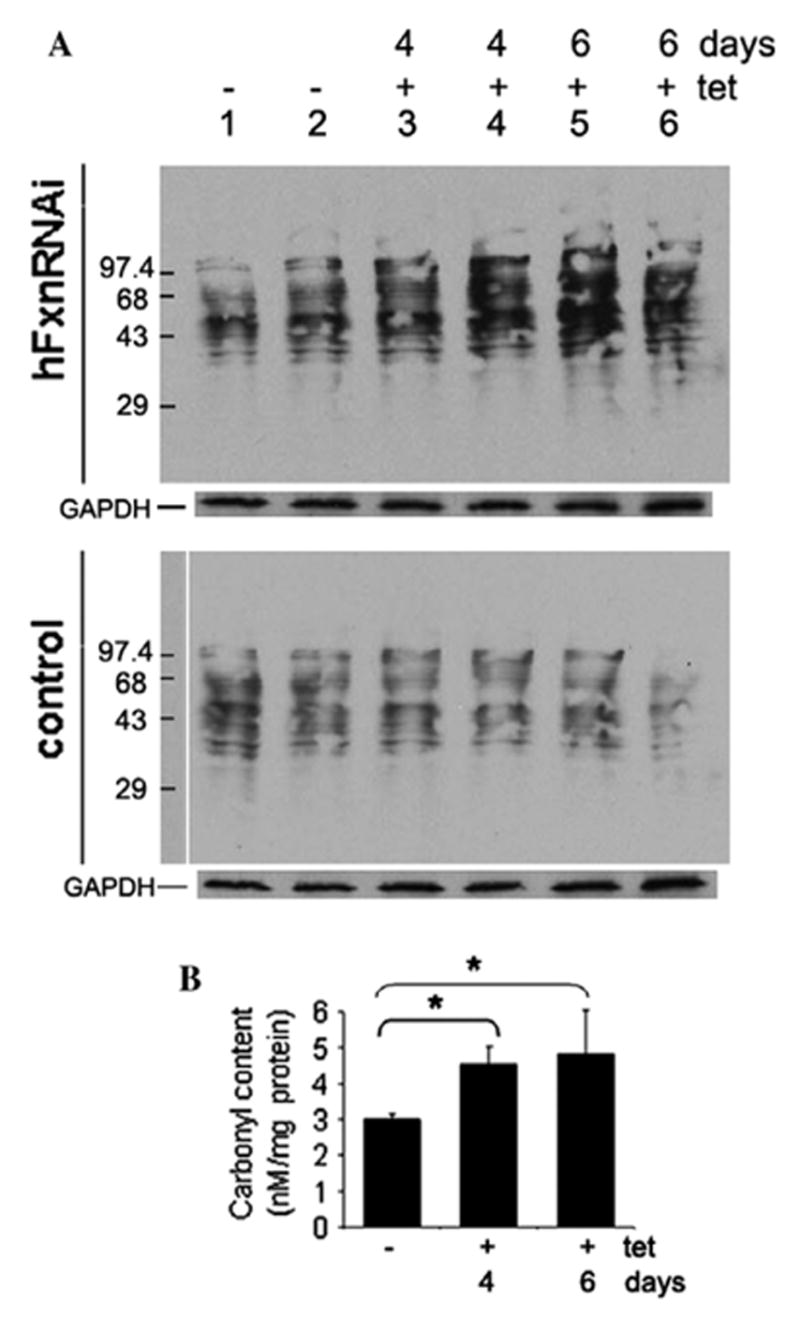
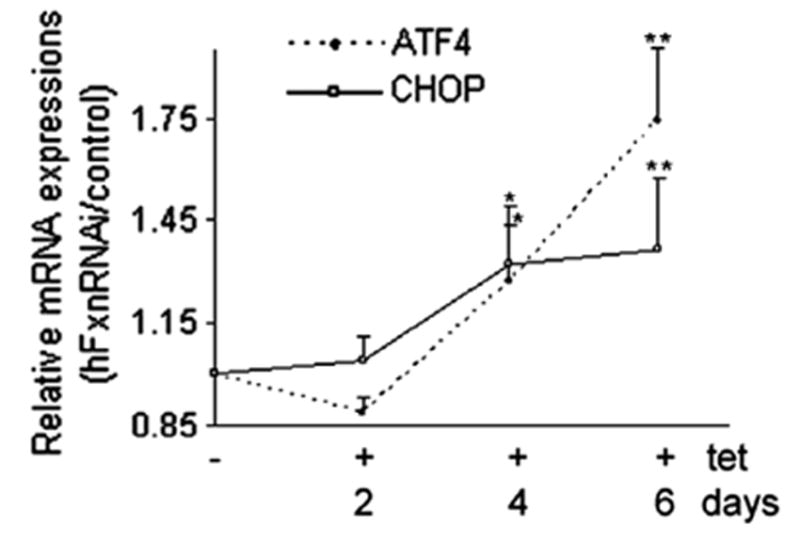
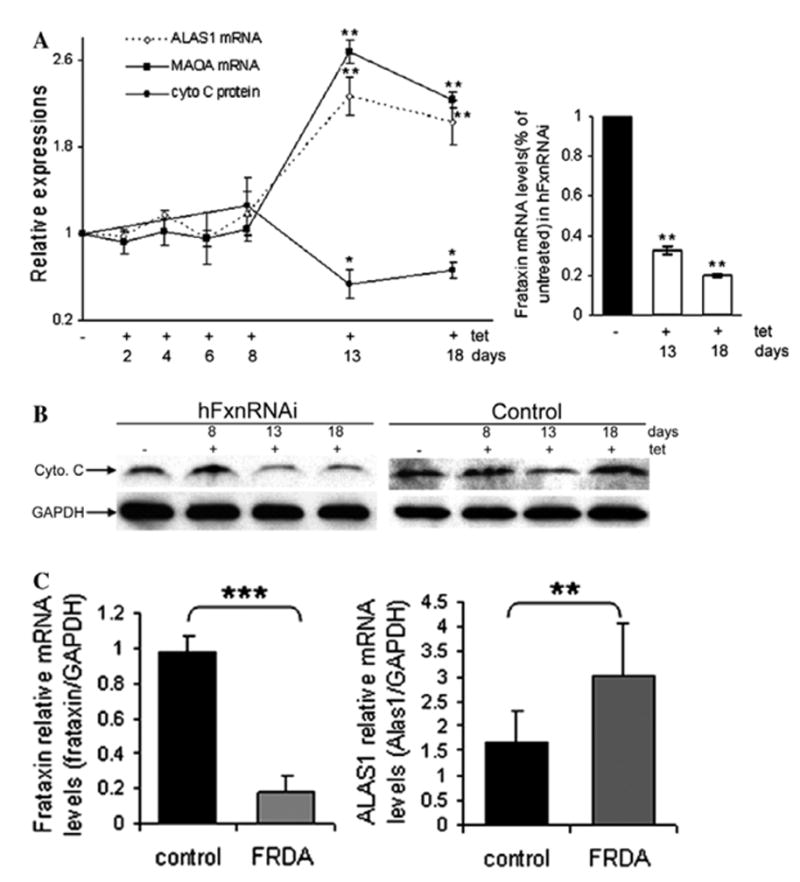
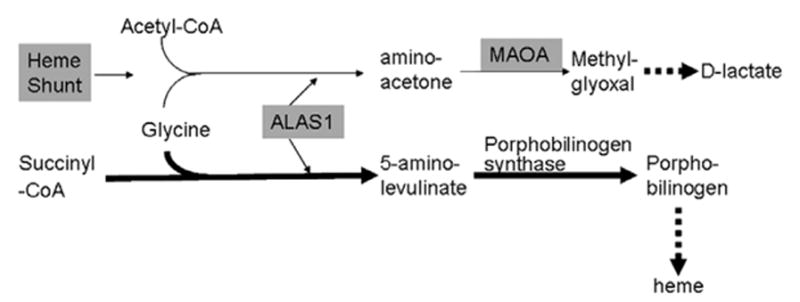
Frataxin protein deficiency causes the neurodegenerative disease Friedreich ataxia. We used inducible siRNA to order the consequences of frataxin deficiency that we and others have previously observed. The earliest consequence of frataxin deficiency was a defect in cytoplasmic iron-sulfur proteins. In the second phase, protein oxidative damage increased, and CuZnSOD was induced, as was the unfolded protein response (UPR), long before any decline in mitochondrial aconitase activity. In the third phase, mitochondrial aconitase activity declined. And in the fourth phase, coincident with the decrease in heme-containing cytochrome c protein, a transcriptional induction of the heme-dependent transcripts ALAS1 and MAOA occurred. These observations suggest that the earliest consequences of frataxin deficiency occur in ISC proteins of the cytoplasm, resulting in oxidative damage and stress and activation of the unfolded protein response which has been associated with neurological disease, and that later consequences involve mitochondrial iron-sulfur cluster deficiency, heme deficiency, and then increased heme biosynthesis.


Figures

Fig. 1
Fig. 1
Inducible frataxin depletion in hFxnRNAi cells by siRNA upon tetracycline induction. Both hFxnRNAi and control clones were subcultured in medium without or with tetracycline for the indicated time, total RNA and protein were harvested for real-time qPCR and Western blot. (A) Frataxin mRNA levels (frataxin/GAPDH) by real-time qPCR and frataxin protein levels (frataxin/COXIV or GAPDH) by densitometry of western blots in hFxnRNAi clones. Data are presented as percentages of basal values in cells treated without tetracycline (means ± SD, n = 4–5 experiments). Asterisks indicate blocked ANOVA p < 0.01 (**) versus basal value, Dunnett post hoc test. (B) Representative Western blots of the cytoplasmic and mitochondrial frataxin protein in hFxnRNAi and control clones (GAPDH and COXIV as loading control). The mature form of frataxin was seen in cytoplasm, besides in mitochondria. The cytoplasmic and mitochondrial frataxin showed different knockdown pattern. (C) Frataxin protein levels and mitochondrial marker proteins in different cellular fractions. Frataxin and mitochondrial proteins aconitase, VDAC and COXIV were assayed by Western blots in total cell lysate (T), cytoplasmic fraction (C) and mitochondrial fraction (M) from untreated cells. Forty micrograms of total lysate, cytoplasmic fraction or mitochondrial fraction were used in each lane. Cell lysate in the first and fourth lane was obtained by using the whole cell lysis buffer described in Experimental Procedures, supplemented with or without 0.5% dodecyl maltoside.
Fig. 2
Fig. 2
Aconitase activity and protein levels in hFxnRNAi cells. (A) Aconitase activity in mitochondrial and cytoplasmic fractions of hFxnRNAi cells. (B) Mitochondrial and cytoplasmic aconitase protein levels by densitometry of the Western blots in hFxnRNAi cells. (C) Representative Western blots of the cytoplasmic and mitochondrial aconitase protein in hFxnRNAi clones. Data in (A) and (B) are presented as percentages of basal values in cells treated without tetracycline (means ± SD, n = 2–3 experiments). Asterisks indicate blocked ANOVA p <0.01 (**) or P ≤ 0.05 (*) versus basal value, Dunnett post hoc test.
Fig. 3
Fig. 3
Cytoplasmic and mitochondrial iron–sulfur assembly scaffold protein (ISU1 and ISU2) levels in hFxnRNAi cells. (A) ISU1 and ISU2 protein levels (ISU1/GAPDH, ISU2/COXIV) by densitometry of Western blots in hFxnRNAi clones. Data are presented as percentages of basal values in cells treated without tetracycline (means ± SD, n = 3 experiments). Asterisks indicate blocked ANOVA p < 0.01 (**) or P ≤ 0.05 (*) versus basal value, Dunnett post hoc test. (B) Representative Western blots of the ISU1 and ISU2 protein in hFxnRNAi and control clones.
Fig. 4
Fig. 4
Cytoplasmic and mitochondrial SOD protein levels in hFxnRNAi cells. (A) CuZnSOD protein levels (CuZnSOD/GAPDH) by densitometry of Western blots in hFxnRNAi clones. Data are presented as percentages of basal values in cells treated without tetracycline (means ± SD, n = 3 experiments). Asterisks indicate blocked ANOVA p < 0.01 (**) or P ≤ 0.05 (*) versus basal value, Dunnett post hoc test. (B) Representative Western blots of the CuZnSOD and MnSOD protein in hFxnRNAi and control clones.
Fig. 5
Fig. 5
Protein carbonyl content in hFxnRNAi cells. (A) Representative immunoblot assay of carbonylated proteins in hFxnRNAi and control clones. Twenty micrograms of protein was loaded for each lane. Lanes 1– 6: DNP-derivatized protein samples, lanes 1 and 2: whole cell lysate from cells treated without tetracycline, lanes 3–6, whole cell lysate from cells treated with tetracycline for 4 or 6 days. GAPDH was used as loading control. (B) Protein carbonyl content in hFxnRNAi clones by spectrophotometric assay. Data are presented as means ± SD (n = 4 experiments) and *P ≤ 0.05 determined by Student’s t-test.
Fig. 6
Fig. 6
ATF4 and CHOP relative mRNA levels (hFxnRNAi/control) by real-time qPCR in hFxnRNAi clones. GAPDH was used as reference gene. Data are presented as percentages of basal values in cells treated without tetracycline (means ± SD, n = 3 experiments). Asterisks indicate blocked ANOVA p < 0.01 (**) or P ≤ 0.05 (*) versus basal value, Dunnett post hoc test.
Fig. 7
Fig. 7
Heme-related transcripts or protein levels in hFxnRNAi cells and FRDA lymphoblasts. (A) ALAS1 and MAOA relative mRNA levels (hFxnRNAi/control) by real-time qPCR and cytochrome c protein levels by densitometry of Western blots in hFxnRNAi clones. GAPDH was used as the reference gene. Data are presented as percentages of basal values in cells treated without tetracycline (means ± SD, n = 3–4 experiments). Asterisks indicate blocked ANOVA p < 0.01 (**) or P ≤ 0.05 (*) versus basal value, Dunnett post hoc test. Frataxin mRNA levels (frataxin/GAPDH) in hFxnRNAi cells remained significantly reduced over this period of time. (B) Representative Western blots of the cytochrome c protein in hFxnRNAi and control clones. (C) Frataxin and ALAS1 relative mRNA levels in FRDA and control lymphoblasts. The error bars represent standard deviation and **P < 0.01 or ***P < 0.001 determined by Student’s t-test.
Fig. 8
Fig. 8
Simplified heme pathway and the shunt pathway.
Fig. 9
Fig. 9
Dose–response study in a representative hFxnRNAi clone. The hFxnRNAi transfectant was subcultured in media containing different tetracycline concentrations, ranging from 0 to 3 μg/mL (i.e., 0, 0.005, 0.05, 0.25, 0.5, 1, 2 and 3 μg/mL tetracycline) for 48 h. Total RNA was isolated and frataxin mRNA levels were assayed by real-time qPCR (GAPDH was used as reference gene). Data are presented as percentages of basal values in cells treated without tetracycline (means ± SD).
Fig. 10
Fig. 10
Frataxin mRNA and protein depletion by siRNA produced upon tetracycline induction at different time points in two selected hFxnRNAi clones. (A) Frataxin relative mRNA levels (frataxin/GAPDH) by real-time qPCR in hFxnRNAi and control clone. (B) Representative Western blot of frataxin protein in hFxnRNAi and control clone, GAPDH as loading control. The bar graph shows the protein levels by densitometry of Western blots in two selected hFxnRNAi clones. Data are presented as percentages of basal values in cells treated without tetracycline (means ± SD).

References

    1. Harding AE. The Hereditary Ataxias and Related Disorders. Churchill Livingstone: Edinburgh; 1984.
    1. Harding AE. The inherited ataxias. Adv Neurol. 1988;48:37–46. - PubMed
    1. Johnson WG. Friedreich ataxia. Clin Neurosci. 1995;3:33–38. - PubMed
    1. Campuzano V, Montermini L, Molto MD, Pianese L, Cossee M, Cavalcanti F, Monros E, Rodius F, Duclos F, Monticelli A, Zara F, Canizares J, Koutnikova H, Bidichandani SI, Gellera C, Brice A, Trouillas P, De Michele G, Filla A, De Frutos R, Palau F, Patel PI, Di Donato S, Mandel JL, Cocozza S, Koenig M, Pandolfo M. Friedreich’s ataxia: autosomal recessive disease caused by an intronic GAA triplet repeat expansion. Science. 1996;271:1423–1427. - PubMed
    1. Campuzano V, Montermini L, Lutz Y, Cova L, Hindelang C, Jiralerspong S, Trottier Y, Kish SJ, Faucheux B, Trouillas P, Authier FJ, Durr A, Mandel JL, Vescovi A, Pandolfo M, Koenig M. Frataxin is reduced in Friedreich ataxia patients and is associated with mitochondrial membranes. Hum Mol Genet. 1997;6:1771–1780. - PubMed

Publication types

LinkOut - more resources