. 2007 Feb 1;92(3):1081-9.
doi: 10.1529/biophysj.106.091884. Epub 2006 Nov 10.

VASP governs actin dynamics by modulating filament anchoring

Affiliations

VASP governs actin dynamics by modulating filament anchoring

Léa Trichet et al. Biophys J. .

Abstract

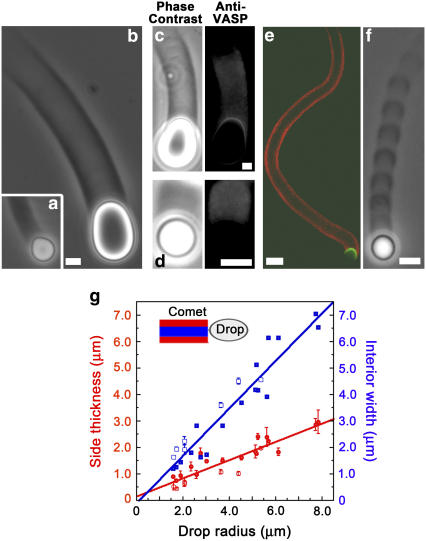
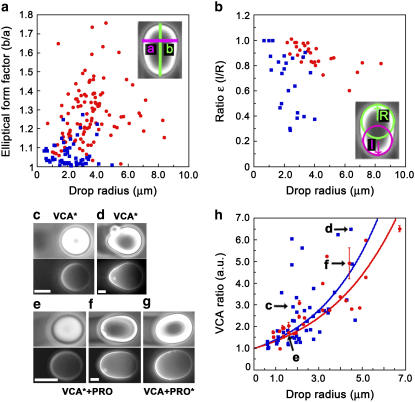
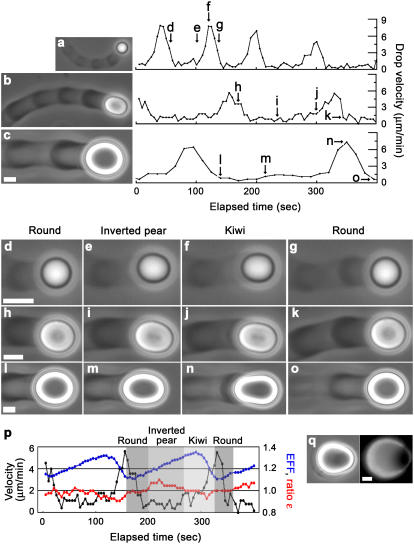
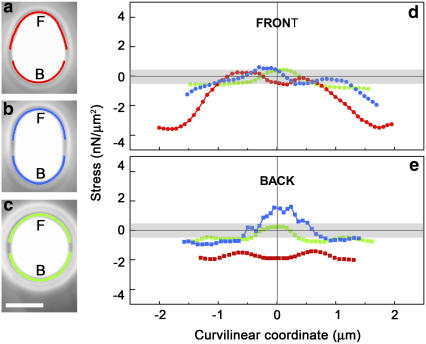
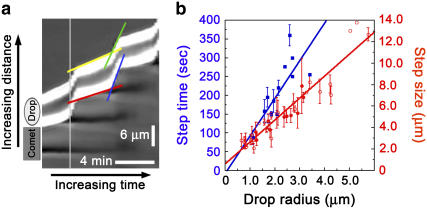
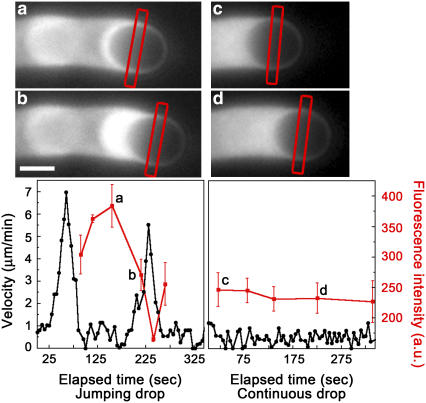
Actin filament dynamics at the cell membrane are important for cell-matrix and cell-cell adhesions and the protrusion of the leading edge. Since actin filaments must be connected to the cell membrane to exert forces but must also detach from the membrane to allow it to move and evolve, the balance between actin filament tethering and detachment at adhesion sites and the leading edge is key for cell shape changes and motility. How this fine tuning is performed in cells remains an open question, but possible candidates are the Drosophila enabled/vasodilator-stimulated phosphoprotein (Ena/VASP) family of proteins, which localize to dynamic actin structures in the cell. Here we study VASP-mediated actin-related proteins 2/3 (Arp2/3) complex-dependent actin dynamics using a substrate that mimics the fluid properties of the cell membrane: an oil-water interface. We show evidence that polymerization activators undergo diffusion and convection on the fluid surface, due to continual attachment and detachment to the actin network. These dynamics are enhanced in the presence of VASP, and we observe cycles of catastrophic detachment of the actin network from the surface, resulting in stop-and-go motion. These results point to a role for VASP in the modulation of filament anchoring, with implications for actin dynamics at cell adhesions and at the leading edge of the cell.


Figures

FIGURE 1
FIGURE 1
Actin comets form on oil droplets recruiting the Arp2/3 complex and VASP. Phase contrast microscopy of droplets coated with VCA shows a full comet that pinches the drop into a pear shape (a), whereas drops coated with a mixture of VCA and PRO have partially hollow comets and are deformed into an oval shape (b). Immunolabeling of VCA+PRO droplets (c) and VCA droplets (d); left panel: phase contrast and right panel: anti-VASP, shows VASP localization at the surface of VCA+PRO droplets, and a stain throughout the comets on both VCA and VCA+PRO droplets. (e) Comet hollowness is confirmed by confocal microscopy. Actin in red, VCA in green. (f) Phase contrast microscopy shows the striped comet of a jumping droplet. All bars are 2 μm except for the confocal image where the bar is 10 μm. (g) Comet wall thicknesses (red circles) and interior cavity spans (blue squares) as a function of drop radius. Measurements were performed using confocal sections (solid symbols) and phase contrast images (open symbols). Both wall thickness and interior span increase linearly with increasing drop size giving line slopes of 0.3 (correlation factor = 0.91) and 0.9 (correlation factor, 0.95), respectively.
FIGURE 2
FIGURE 2
Droplets recruiting VASP in addition to the Arp2/3 complex are more elongated but less pinched than droplets recruiting the Arp2/3 complex alone, and both drop types accumulate VCA under the comet. (a) Elliptical form factors, calculated by dividing the long axis “b” of the drop by the small axis “a” and (b) Values of the ɛ ratio, calculated by transcribing the front and the back of the drop as circles, and then dividing the radius of the back circle “l” by the radius of the front circle “R”. Both parameters are plotted as a function of radius for drops recruiting the Arp2/3 complex only (blue squares) or VASP in addition to the Arp2/3 complex (red circles). Paired phase contrast (top) and fluorescence (bottom) images of VCA (c,d) and VCA+PRO (eg) drops undergoing continuous motion. The asterisks in the labels indicate which molecules are fluorescently labeled. Bars 2 μm. (h) Intensities of VCA fluorescence were recorded along the long axis of moving drops, and the intensity under the comet was divided by the intensity at the front of the drop to give the VCA ratio in arbitrary units, which was plotted as a function of drop radius. Droplets coated with VCA alone (blue squares) and droplets coated with VCA+PRO (red circles). The points fit to exponential functions (solid lines) with exponents of 0.34 ± 0.02 μm−1 and 0.30 ± 0.01 μm−1, respectively. Letters on the graph refer to the images (cf).
FIGURE 3
FIGURE 3
VASP-recruiting droplets in a range of sizes display jumping behavior involving velocity changes, actin density variations in the comet, and shape modulations. Phase contrast microscopy of (a) radius = 1.2 μm, (b) radius = 2.1 μm, and (c) radius = 3.4 μm jumping drops and their accompanying velocity cycles as a function of elapsed time. Arrows on the velocity cycle graphs refer to blowups (do) featuring drop deformations at various times of each cycle. (p) A summary of how shape changes are associated with velocity changes, with elliptical form factors (blue) and ɛ ratios (red) plotted as an overlay on a velocity cycle. (q) shows a droplet where the symmetrical actin cloud that precedes comet formation is breaking open, phase contrast (left panel) and fluorescence microscopy using labeled actin (right panel). All bars are 2 μm.
FIGURE 4
FIGURE 4
Analysis of contours indicates that the distribution and magnitude of pushing and pulling normal stresses on the drop vary over the course of a jump. (ac) Blowups of phase contrast images of inverted pear, kiwi, and round shapes recorded during the velocity jump of a 1.7-μm radius drop and analysis of the stresses developed at the drop surface as a function of position along the contour for the front (d) and the back (e) of the drop. The x coordinate corresponds to the distance along the contour length from the zero position, which is placed at the extreme front and back of the drop (“F” and “B” in ac). The gray bands in d and e indicate the estimated error in the calculated normal stress, ±0.5 nN/μm2, derived from errors in the generation of r1, r2, and R values from the smoothed profile (see Materials and Methods). The traces in d and e correspond to stresses in the regions traced out in the same color on the phase contrast images. The gaps in the contours are a result of the smoothing process. Bar, 2 μm.
FIGURE 5
FIGURE 5
Kymograph analysis of jumps and parameters of the velocity cycle. (a) Kymograph derived from a phase contrast time-lapse acquisition of the drop shown in Fig. 3 c, radius = 3.4 μm. The drop is moving upward, the edges of the drop appear white, and the slopes of the white portions correspond to the velocities of the front and back of the drop. Green and yellow lines depict the front of the drop during the high-speed and low-speed phases, respectively, and blue and red lines mark out the back of the drop during the high-speed and low-speed phases, respectively. Dark stripes behind the drop indicate the high density phases of the comet, which do not extend to the right side of the kymograph due to a change in focal plane of the drop. (b) Step time and step size are dependent on the size of the drop. In blue (squares), the elapsed time between maximum velocity peaks as a function of drop size. The dependence is linear with a slope of 100.4 s/μm (correlation factor = 0.78). In red (circles) the distance between actin-rich stripes as a function of drop radius, measured on phase contrast images (open symbols) and confocal slices (filled symbols). The dependence is linear with a slope of 2.1 (correlation factor, 0.95).
FIGURE 6
FIGURE 6
Form changes during the velocity cycle of jumping drops are associated with changes in the amount of actin along the sides of the drop, variations that are not observed during continuous motion. Fluorescence microscopy images using labeled actin of a jumping 1.6-μm radius drop in inverted pear form (a) and kiwi form (b) and a continuous 1.7-μm radius drop (cd). Accompanying velocity cycle graphs for each drop are shown below the images. Fluorescence intensity (red curves, arbitrary units) was measured along the sides of the drop at various times during drop movement using line scans of fluorescence intensity of the center of the drop, perpendicular to the direction of movement. For the images shown, the region where the fluorescence was measured is marked by the red rectangles, and these points are indicated by the small letters in the velocity graphs. The error bars on the fluorescence intensity indicate the standard deviations from the average of the two sides of the drop. Bar, 2 μm.

References

    1. Pollard, T. D., L. Blanchoin, and R. D. Mullins. 2000. Molecular mechanisms controlling actin filament dynamics in nonmuscle cells. Annu. Rev. Biophys. Biomol. Struct. 29:545–576. - PubMed
    1. Kovar, D. R. 2006. Molecular details of formin-mediated actin assembly. Curr. Opin. Cell Biol. 18:11–17. - PubMed
    1. Krause, M., E. W. Dent, J. E. Bear, J. J. Loureiro, and F. B. Gertler. 2003. Ena/VASP proteins: regulators of the actin cytoskeleton and cell migration. Annu. Rev. Cell Dev. Biol. 19:541–564. - PubMed
    1. Hüttelmaier, S., B. Harbeck, O. Steffens, T. Messerschmidt, S. Illenberger, and B. M. Jockusch. 1999. Characterization of the actin binding properties of the vasodilator-stimulated phosphoprotein VASP. FEBS Lett. 451:68–74. - PubMed
    1. Reinhard, M., C. Giehl, K. Abel, C. Haffner, T. Jarchau, V. Hoppe, B. M. Jockusch, and U. Walter. 1995. The proline-rich focal adhesion and microfilament protein VASP is a ligand for profilins. EMBO J. 14:1583–1589. - PMC - PubMed

Publication types

MeSH terms

LinkOut - more resources