. 2006 Nov;18(11):3132-44.
doi: 10.1105/tpc.106.043018. Epub 2006 Nov 10.

A membrane-bound NAC transcription factor regulates cell division in Arabidopsis

Affiliations

A membrane-bound NAC transcription factor regulates cell division in Arabidopsis

Youn-Sung Kim et al. Plant Cell. 2006 Nov.

Abstract

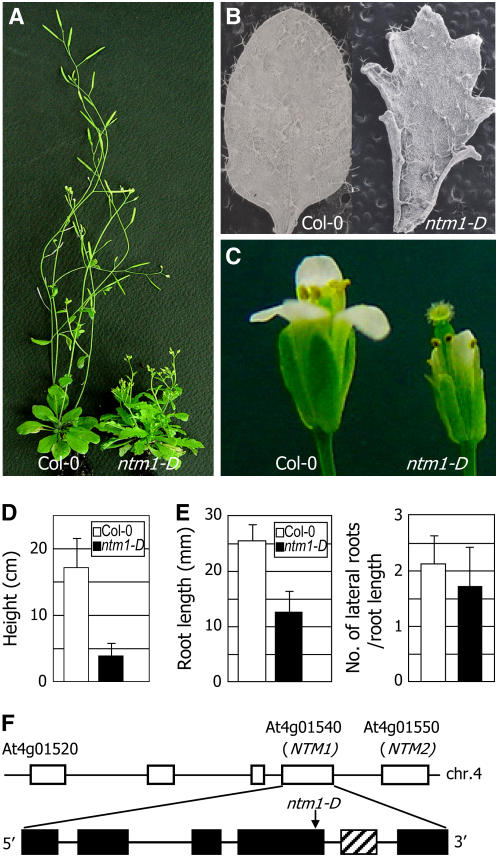
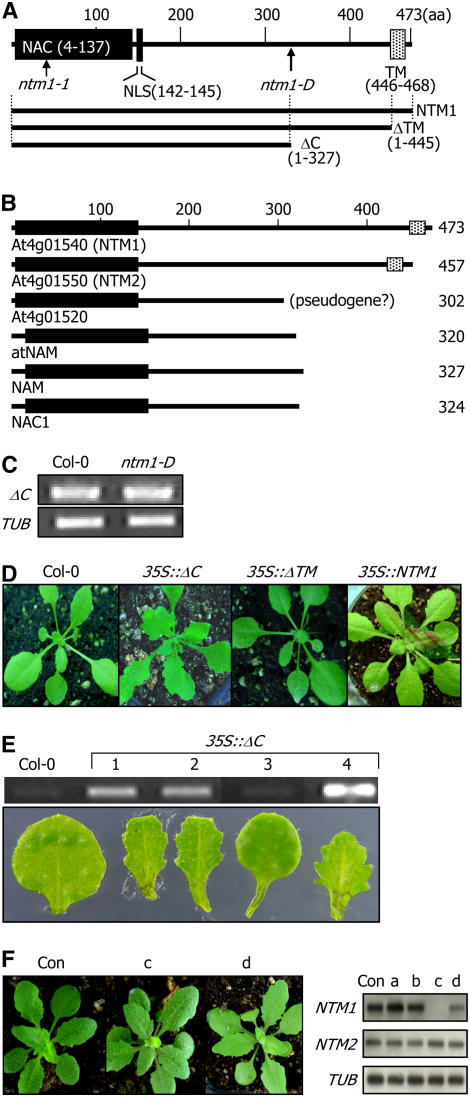
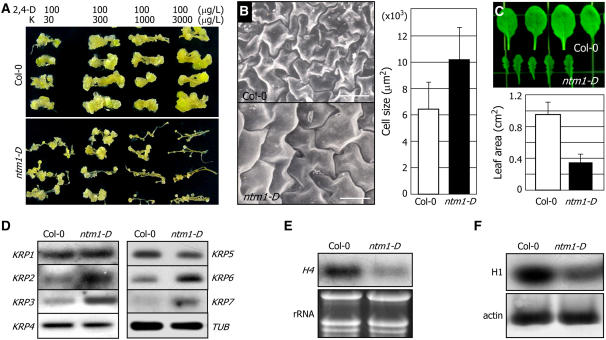
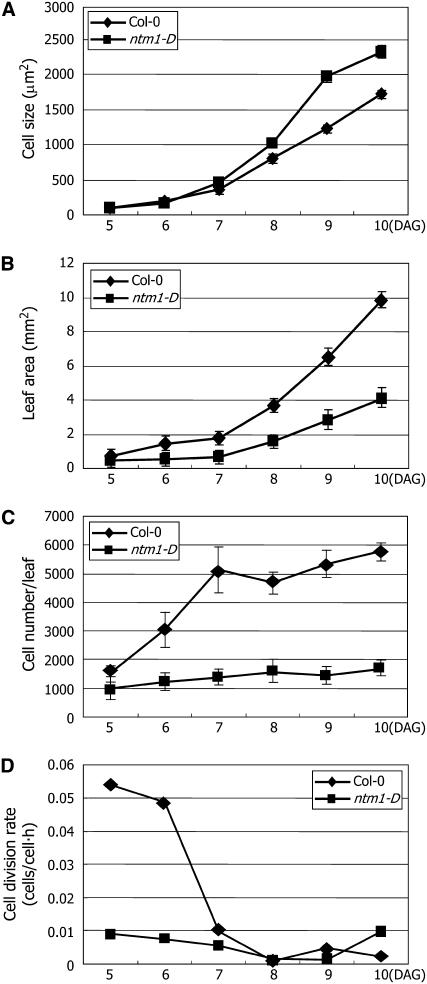
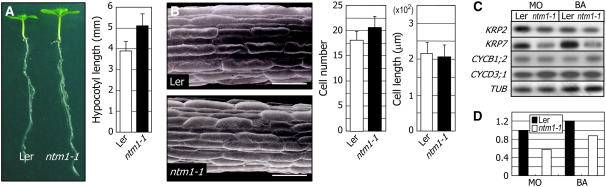
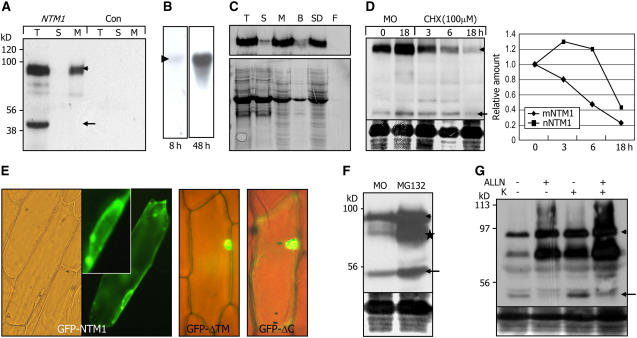
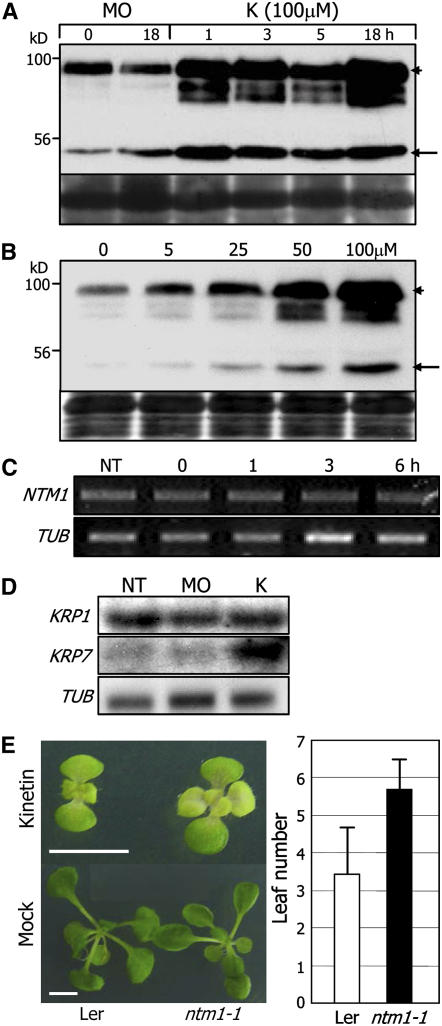
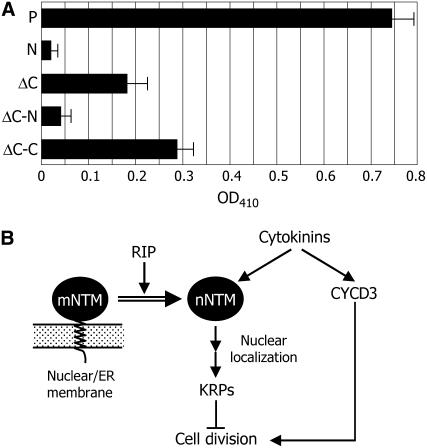
Controlled release of membrane-tethered, dormant precursors is an intriguing activation mechanism that regulates diverse cellular functions in eukaryotes. An exquisite example is the proteolytic activation of membrane-bound transcription factors. The proteolytic cleavage liberates active transcription factors from the membranes that can enter the nucleus and evokes rapid transcriptional responses to incoming stimuli. Here, we show that a membrane-bound NAC (for NAM, ATAF1/2, CUC2) transcription factor, designated NTM1 (for NAC with transmembrane motif1), is activated by proteolytic cleavage through regulated intramembrane proteolysis and mediates cytokinin signaling during cell division in Arabidopsis thaliana. Cell proliferation was greatly reduced in an Arabidopsis mutant with retarded growth and serrated leaves in which a transcriptionally active NTM1 form was constitutively expressed. Accordingly, a subset of cyclin-dependent kinase (CDK) inhibitor genes (the KIP-related proteins) was induced in this mutant with a significant reduction in histone H4 gene expression and in CDK activity. Consistent with a role for NTM1 in cell cycling, a Ds element insertional mutant was morphologically normal but displayed enhanced hypocotyl growth with accelerated cell division. Interestingly, cytokinins were found to regulate NTM1 activity by controlling its stability. These results indicate that the membrane-mediated activation of NTM1 defines a molecular mechanism by which cytokinin signaling is tightly regulated during cell cycling.


Figures

Figure 1.
Figure 1.
The Phenotype Conferred by ntm1-D, and Mapping of the T-DNA Insertion Site. (A) Retarded growth, with small plant organs. (B) Serrated leaves. Leaves were compared by scanning electron micrography. (C) Impaired petal development. (D) and (E) Short stems (D) and reduced primary root growth and lateral root formation (E). The number of lateral roots was counted for unit root length. Measurements of 30 plants were averaged. Bars indicate sd. The statistical significance of the measurements was determined by Student's t test (P < 0.01). (F) T-DNA insertion in the ntm1-D genome. ntm1-D has a single insertion event, as indicated by the arrow, in the fourth exon of NTM1. The hatched box marks the exon newly identified in this work.
Figure 2.
Figure 2.
NTM1 Structure and Transgenic Arabidopsis Plants Expressing Different NTM1 Constructs. (A) NTM1 structure. A putative nuclear localization signal (NLS) is recognized close to the NAC domain. A TM motif is present in the far C-terminal region. Numbers indicate amino acid (aa) positions. (B) Structural comparison of NTM1 with other NAC proteins. NTM1 and NTM2 have TM motifs. Note that the ΔC construct in (A) has a similar size to those of other NAC proteins. (C) ΔC transcription in ntm1-D. A tubulin gene (TUB) was used as a control for constitutive expression. (D) Transgenic Arabidopsis plants overexpressing different NTM1 proteins. Three different NTM1 proteins with or without the TM motif were expressed. (E) Correlation between serrated leaves and ΔC expression. Four transgenic lines with different ΔC transcript levels were compared. (F) Transgenic Arabidopsis plants in which NTM1 expression is specifically blocked by RNA interference. Two transgenic plants (c and d) have normal leaves. Con, control transgenic plant with vector alone.
Figure 3.
Figure 3.
Reduced Cell Division in ntm1-D. (A) Reduced callus growth from primary root segments. Primary root segments were cultured on a callus induction medium in the presence of different concentrations of 2,4-D and kinetin (K). (B) Enlarged cells. Sizes of the cells from the adaxial sides of leaves were compared by scanning electron micrography and displayed by bar graphs. The statistical significance of the measurements was determined by Student's t test (P < 0.01). The error shown is sd (n = 85). Bars = 50 μm. (C) Reduced leaf sizes. Twenty measurements of the sizes of fifth leaves were averaged. The error shown is sd. (D) Increased KRP expression. The transcript levels of KRPs were examined by RT-PCR–based DNA gel blot analysis using the leaves of 2-week-old plants. (E) Reduced H4 gene expression. H4 expression was analyzed by RNA gel blot analysis. (F) Reduced CDK activities. CDK activities were compared using histone H1 as a general phosphorylation substrate.
Figure 4.
Figure 4.
Kinematic Analysis of Leaf Growth in ntm1-D. Kinematic analysis of leaf growth was performed on plants grown on MS medium. Error bars indicate sd. The statistical significance of the measurements was determined by Student's t test (P < 0.01). DAG, days after germination. (A) Cell size measurements. Cell sizes were determined from three independent measurements, each consisting of at least 100 adaxial epidermal cells, and averaged (P < 0.01). (B) Leaf area measurements. (C) Cell number per leaf. (D) Estimated cell division rates.
Figure 5.
Figure 5.
Characterization of ntm1-1. (A) Growth phenotype. Thirty hypocotyls were measured from 5-d-old seedlings grown in the light and averaged. The error shown is sd. (B) Hypocotyl cells. Midhypocotyl regions were compared from the seedlings shown in (A). Scanning electron micrographic images of 11 hypocotyls of 2-week-old seedlings were used to count epidermal cells and averaged. The statistical significance of the measurements was determined by Student's t test (P < 0.01). The error shown is sd. Bars = 100 μm. (C) Expression of KRPs. For detection of KRP expression in ntm1-1, plants were sprayed with an N6-benzyladenine solution (BA; 500 μM), and total RNAs were extracted from the leaf tissues. MO indicates mock treatment. A tubulin gene (TUB) was used as a control for constitutive expression. (D) Relative levels of CYCD3;1 expression. The relative levels of CYCD3;1 expression in (C) were quantitated. The levels were compared with those in the mock-treated (MO) Col-0.
Figure 6.
Figure 6.
NTM1 Release from the Intracellular Membranes by Proteolytic Cleavage. The aerial parts of 2-week-old plants were used to examine cycloheximide and MG132 effects on NTM1 processing and stability. The arrowheads and arrows indicate putative membrane-associated (mNTM1) and nuclear (nNTM1) forms, respectively. (A) Cell fractionation assays. Total extract (T) of N. benthamiana leaf cells expressing a myc-NTM1 fusion was fractionated into soluble (S) and microsomal (M) fractions, and the myc-NTM1 proteins were detected using an anti-myc antibody. Control leaves (Con) injected with the vector alone were analyzed for comparison. (B) NTM1 transcript profile in the transgenic plants overexpressing myc-NTM1. Twenty-five micrograms of total RNA sample was analyzed by RNA gel blot hybridization and exposed for up to 48 h. (C) Membrane association of NTM1. Aliquots of each fraction were mixed with an equal volume of the SDS buffer and subjected to protein gel blot analysis (top panel) using an anti-myc antibody. The Commassie blue–stained membrane is displayed as a loading control (bottom panel). T, total extract; S, soluble fraction; M, membrane fraction; B, buffer-extracted fraction; SD, SDS-extracted fraction; F, final membrane fraction (see Supplemental Figure 3 online). (D) Cycloheximide (CHX) effect on the NTM1 processing. MO, mock treatment. (E) Subcellular localization of NTM1 proteins. The inset shows a magnified view of the nuclear region to illustrate dense localization of the GFP-NTM1 fusion on the nuclear/endoplasmic reticulum membranes around the nucleus. (F) MG132 effect on NTM1 stability. Asterisk marks a putative intermediate form. (G) NTM1 cleavage by calpain protease. A calpain inhibitor (ALLN) was included in the assays. K, kinetin.
Figure 7.
Figure 7.
Cytokinin Regulation of NTM1 Function. The mNTM1 (arrowheads) and nNTM1 (arrows) polypeptides are indicated. Parts of Commassie blue–stained gels are displayed as loading controls. (A) Kinetics of kinetin effects on NTM1 stability. Transgenic Arabidopsis plants overexpressing a myc-NTM1 fusion construct were treated with 100 μM kinetin (K). MO refers to mock treatment. (B) Treatment with different concentrations of kinetin. Transgenic plants were treated with increasing concentrations of kinetin for 14 h. (C) Kinetin effects on NTM1 expression. Wild-type plants were treated with 100 μM kinetin for up to 6 h. NT, no treatment. (D) Kinetin effects on KRP expression. Twelve-day-old plants were treated with 100 μM kinetin for 6 h. Twenty-five micrograms of total RNA samples extracted from the leaves was loaded onto each lane. (E) Growth response of ntm1-1 to kinetin. ntm1-1 plants were germinated and cultured on MS medium supplemented with 1 μM kinetin for 3 weeks. Thirty plants per plant group were measured and averaged. Bars denote sd. The statistical significance of the measurements was determined by Student's t test (P < 0.01). Bars = 0.5 mm. Ler, Landsberg erecta.
Figure 8.
Figure 8.
A Schematic Working Model for the NTM1 Transcription Factor. (A) Analysis of transcriptional activities. P, positive control (full-size GAL4); N, negative control (DNA binding domain alone); ΔC-N and ΔC-C, N-terminal and C-terminal regions of ΔC, respectively. Four independent measurements were averaged (P < 0.01). The error shown is sd. (B) Proposed mechanism for NTM1 function in cell cycle control. The nuclear form (nNTM1) is liberated from the nuclear/endoplasmic reticulum (ER) membranes through regulated intramembrane proteolysis (RIP). Cytokinins stabilize the NTM1 proteins, possibly by blocking the 26S proteasome activity. In this scheme, the CYCD3-mediated cytokinin signaling is likely to be balanced with the negative regulatory effect exerted by NTM1, similar to that described for c-MYC function in cell division in animals (O'Donnell et al., 2005).

Similar articles

Cited by

References

    1. Ahn, J., Kim, M., Lim, J.H., Kim, K.-T., and Pai, H.-S. (2004). Phytocalpain controls the proliferation and differentiation fates of cells in plant organ development. Plant J. 38 969–981. - PubMed
    1. Aida, M., Ishida, T., Fukaki, H., Fujisawa, H., and Tasaka, M. (1997). Genes involved in organ separation in Arabidopsis: An analysis of the cup-shaped cotyledon mutant. Plant Cell 9 841–857. - PMC - PubMed
    1. Arabidopsis Genome Initiative (2000). Analysis of the genome sequence of the flowering plant Arabidopsis thaliana. Nature 408 796–815. - PubMed
    1. Brown, M.S., Ye, J., Rawson, R.B., and Goldstein, J.L. (2000). Regulated intramembrane proteolysis: A control mechanism conserved from bacteria to humans. Cell 100 391–398. - PubMed
    1. D'Agostino, I.B., Deruère, J., and Kieber, J.J. (2000). Characterization of the response of the Arabidopsis response regulator gene family to cytokinin. Plant Physiol. 124 1706–1717. - PMC - PubMed

Publication types

MeSH terms