. 2006 Nov;18(11):3088-105.
doi: 10.1105/tpc.105.040741. Epub 2006 Nov 10.

Arabidopsis SAMT1 defines a plastid transporter regulating plastid biogenesis and plant development

Affiliations

Arabidopsis SAMT1 defines a plastid transporter regulating plastid biogenesis and plant development

Florence Bouvier et al. Plant Cell. 2006 Nov.

Abstract

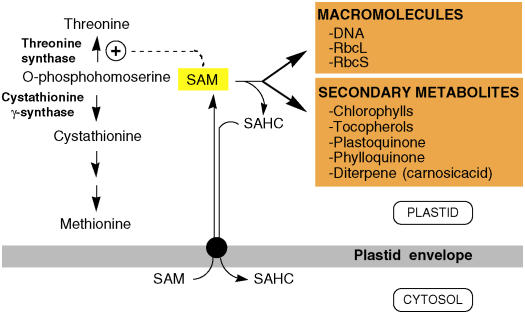
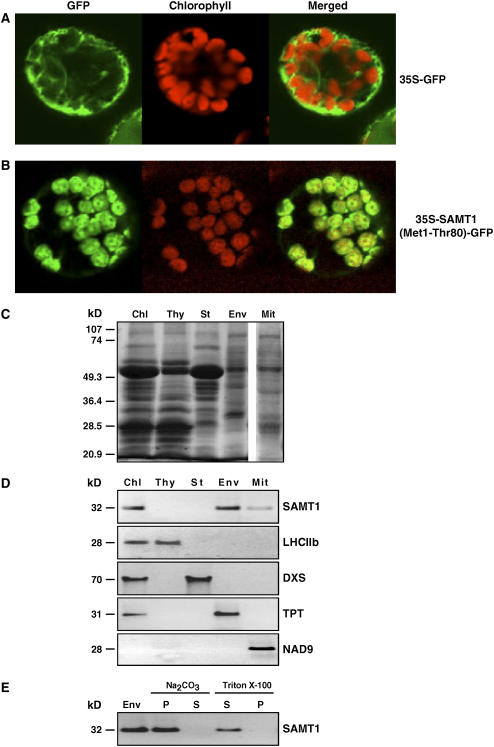
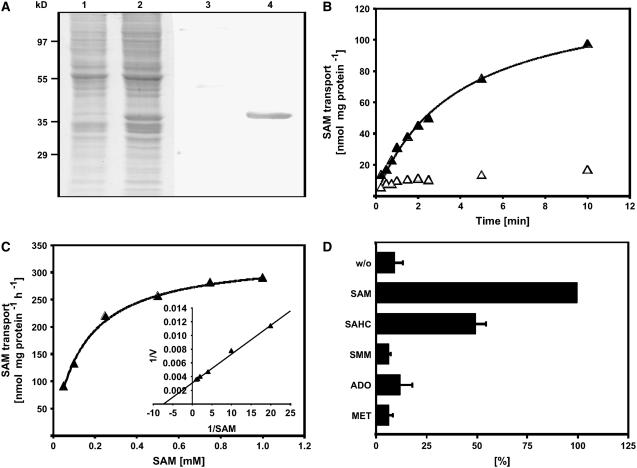
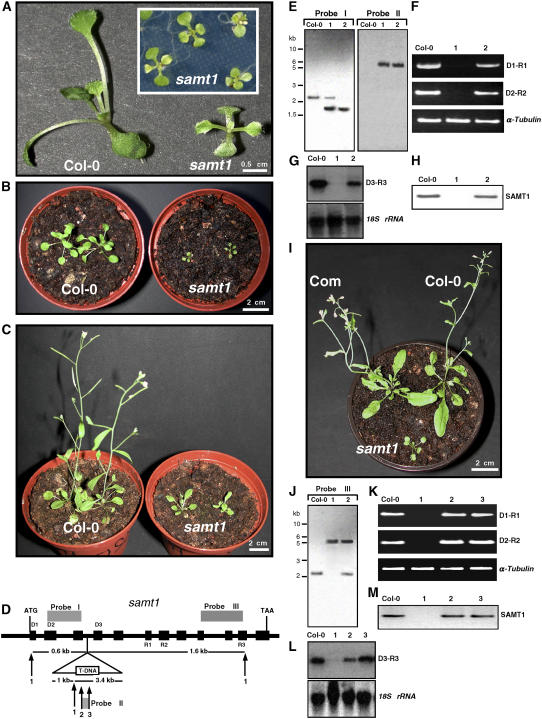
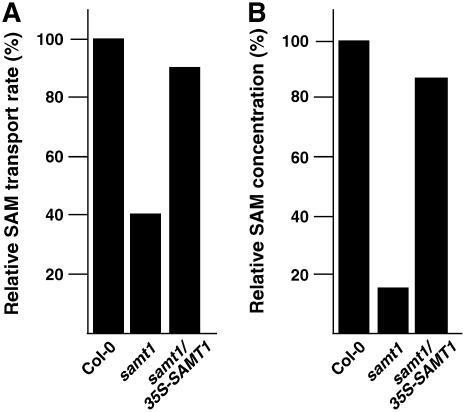
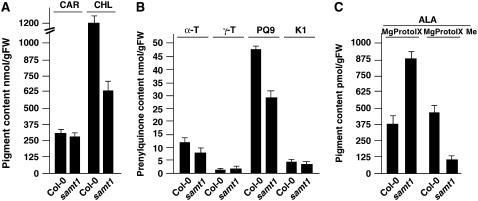
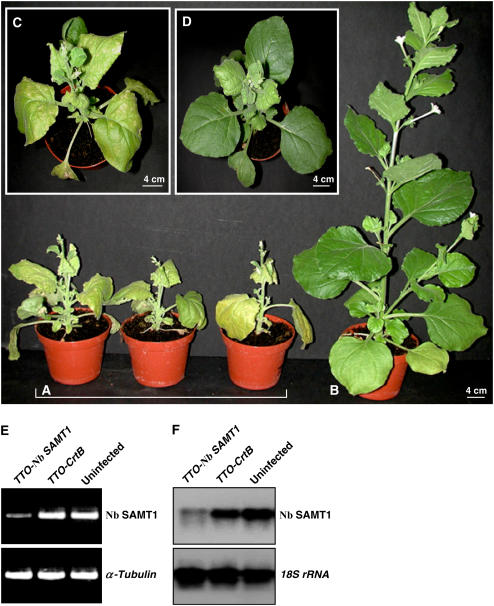
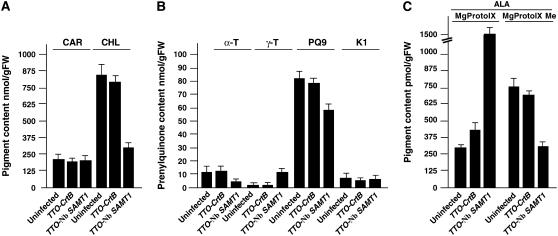
S-Adenosylmethionine (SAM) is formed exclusively in the cytosol but plays a major role in plastids; SAM can either act as a methyl donor for the biogenesis of small molecules such as prenyllipids and macromolecules or as a regulator of the synthesis of aspartate-derived amino acids. Because the biosynthesis of SAM is restricted to the cytosol, plastids require a SAM importer. However, this transporter has not yet been identified. Here, we report the molecular and functional characterization of an Arabidopsis thaliana gene designated SAM TRANSPORTER1 (SAMT1), which encodes a plastid metabolite transporter required for the import of SAM from the cytosol. Recombinant SAMT1 produced in yeast cells, when reconstituted into liposomes, mediated the counter-exchange of SAM with SAM and with S-adenosylhomocysteine, the by-product and inhibitor of transmethylation reactions using SAM. Insertional mutation in SAMT1 and virus-induced gene silencing of SAMT1 in Nicotiana benthamiana caused severe growth retardation in mutant plants. Impaired function of SAMT1 led to decreased accumulation of prenyllipids and mainly affected the chlorophyll pathway. Biochemical analysis suggests that the latter effect represents one prominent example of the multiple events triggered by undermethylation, when there is decreased SAM flux into plastids.


Figures

Figure 1.
Figure 1.
Role of Plastid SAMT in Plants. SAM is synthesized exclusively in the cytosol and transported to the stroma through a plastid envelope–localized SAMT (black circle). In plastids, SAM is engaged in the allosteric activation of Thr synthase or used by methyltransferases acting on macromolecules and secondary metabolites as shown. During these methyl transfer reactions, each SAM releases one S-adenosylhomocysteine (SAHC) as a by-product, which is exported in the cytosol. RbcL and RbcS refer to the large and small subunits of ribulose-1,5-bis-phosphate carboxylase/oxygenase (Rubisco).
Figure 2.
Figure 2.
Subcellular and Suborganellar Localization of SAMT1 in the Plant Cell. The first 80 N-terminal amino acids (Met-1 to Thr-80) of SAMT1 were fused translationally to the green fluorescent protein (GFP). The corresponding DNA construct was fused to the cauliflower mosaic virus 35S promoter to give 35S-SAMT1(Met1-Thr80)-GFP. A construct without translational fusion between the first 80 N-terminal residues and the GFP (35S-GFP) was used as a control. Each construct was introduced into tobacco protoplasts using polyethylene glycol–mediated transformation, and the localization of the fluorescence was examined 20 h after transformation. The merged images of GFP and chlorophyll autofluorescence are shown. (A) GFP fluorescence in a protoplast expressing the construct without translational fusion between GFP and the first 80 N-terminal amino acids (35S-GFP). (B) GFP was translationally fused to the first 80 N-terminal amino acids (Met-1 to Thr-80) of SAMT1 to give 35S-SAMT1(Met1-Thr80)-GFP. (C) SDS-PAGE analysis of total chloroplast (Chl), thylakoid membrane (Thy), stromal (St), chloroplast envelope membrane (Env), and total mitochondrial (Mit) proteins. Fifty micrograms of proteins was separated and stained using Coomassie blue. The mobilities of standard proteins of known molecular mass are indicated at left. (D) Immunoblot analysis of total chloroplast (Chl), thylakoid membrane (Thy), stromal (St), chloroplast envelope membrane (Env), and total mitochondrial (Mit) proteins. Equal amounts of proteins (50 μg) were separated by SDS-PAGE, blotted, and subjected to protein gel blot analysis using SAMT1-specific antibodies or antibodies against the following marker proteins: light-harvesting chlorophyll a/b complex (LHCIIb; thylakoid membranes), 1-deoxy-d-xylulose 5-phosphate synthase (DXS; chloroplast stroma), triose phosphate translocator (TPT; chloroplast envelope membranes), and NADH dehydrogenase (NAD9) for the respiratory chain NADH dehydrogenase (complex I) of mitochondria. Numbers at left indicate molecular masses. (E) Suborganellar localization of SAMT1. Chloroplast envelope membranes (Env) were treated with 0.5 M Na2CO3, pH 11.5, or 2% Triton X-100 for 30 min at 0°C. After ultracentrifugation (100,000g), the pellet (P) and the supernatant (S) were used for immunoblot analysis using anti-SAMT1. The molecular mass of SAMT1 is indicated at left.
Figure 3.
Figure 3.
Expression of SAMT1 in Transgenic Cells, and Determination of Apparent Km and Substrate Specificity of Recombinant SAMT1. (A) Coomassie blue–stained SDS-PAGE gel showing the total membrane fraction of yeast cells transformed with either the empty expression vector (lane 1) or the expression vector harboring the cDNA encoding SAMT1 (lane 2), and protein gel blot of an identical gel (lanes 3 and 4). Control cells and expression lines were processed in parallel, including induction of expression by the addition of galactose. After transfer of proteins from the gel to a membrane, the proteins were immunodecorated using an anti-penta-His antibody. Lanes 1 and 3, control cells; lanes 2 and 4, yeast line expressing SAMT1. (B) Time kinetics of SAM transport into liposomes reconstituted with SAMT1. Uptake of SAM into liposomes that had been reconstituted with SAMT1 and preloaded with 20 mM SAM was induced by the addition of radiolabeled SAM to the liposome suspension. Aliquots were removed after 20, 30, 40, 60, 80, 120, 140, 300, and 600 s, and the transport reaction was terminated by loading the liposome suspension onto ion-exchange columns. SAM transport was quantified by liquid scintillation counting of the column pass-through. Open symbols and closed symbols refer to liposomes reconstituted with membranes from control cells and cells expressing SAMT1, respectively. (C) Determination of the apparent Km value of SAMT1. Rates of SAM uptake into liposomes preloaded with 20 mM SAM were quantified independent of various external SAM concentrations. The inset shows a double-reciprocal plot of the data (Lineweaver-Burk plot) that was used to determine the apparent Km value of SAMT1 for SAM transport. Results from one representative experiment of five independent replicates are shown. The apparent Vmax observed in the experiment shown was 357 nmol SAM·mg−1 protein·h−1. (D) Substrate specificity of SAMT1. The substrate specificity of SAMT1 was determined by quantifying the rate of SAM transport into liposomes that had been preloaded with 20 mM SAM, SAHC, SMM, adenosine, Met, or control substrate (gluconate). SAM transport was quantified as described for (B). The data shown are arithmetic means ± sd from five independent replicates. ADO, adenosine; w/o, control (i.e., without internal substrates).
Figure 4.
Figure 4.
Phenotypic and Molecular Analyses of Arabidopsis Wild-Type (Col-0) and samt1 Mutant Plants. (A) Twelve-day-old plants were grown on agar-solidified Murashige and Skoog medium supplemented with 0.5% sucrose. (B) and (C) Four-week-old (B) and 5-week-old (C) plants were grown for 14 d on Murashige and Skoog agar medium supplemented with 0.5% sucrose before photoautotrophic growth on damp compost. (D) Gene structure of SAMT1, and position of the T-DNA insertion. Black boxes and thick lines indicate the positions of exons and introns, respectively. The triangle represents the T-DNA (not drawn to scale) inserted in position +641 of the SAMT1 genomic sequence. The positions of the primers used for RT-PCR (D1, D2, D3, R1, R2, and R3) and the probes (I to III) used for RNA and DNA gel blots are indicated. Numbers indicate SacI (1), KpnI (2), and ScaI (3) restriction sites. (E) DNA gel blot analysis of genomic DNA from SAMT1 (Col-0), heterozygous samt1 (1), and homozygous samt1 (2) plants digested with SacI and probed with probes I and II. (F) RT-PCR analysis of SAMT1 gene expression in wild-type (Col-0), homozygous samt1 (1), and heterozygous samt1 (2) plants. Primers used are indicated at right. Amplification of α-tubulin mRNA was used as a positive control. PCR was performed for 27 cycles (α-tubulin) and 35 cycles (SAMT1). (G) RNA gel blot analysis of SAMT1 gene expression in wild-type and samt1 plants. Total RNA (10 μg) was isolated from wild-type (Col-0), homozygous samt1 (1), and heterozygous samt1 (2) plants. Blots were hybridized with SAMT1 probe and with 18S rRNA probe to verify equivalent sample loading. (H) Protein gel blot analysis of SAMT1 in wild-type (Col-0), homozygous samt1 (1), and heterozygous samt1 (2) plants. Fifty micrograms of chloroplast proteins was separated by SDS-PAGE, blotted, and subjected to immunoblot analysis using SAMT1-specific antibodies. (I) Complementation of the samt1 mutant. Phenotypes of 5-week-old wild-type (Col-0) and homozygous samt1 and complementation transgenic (samt1/35S-SAMT1) (Com) lines are shown. (J) DNA gel blot analysis of genomic DNA from wild-type (Col-0), homozygous samt1 (1), and complemented (samt1/35S-SAMT1) (2) plants. Genomic DNA was digested with SacI and hybridized with probe III. (K) RT-PCR analysis of SAMT1 expression in the wild type (Col-0) and in the homozygous samt1 (1), the heterozygous samt1 (2), and the complemented (samt1/35S-SAMT1) (3) lines. Primers used are indicated at right. Amplification of α-tubulin mRNA was used as a positive control. PCR was performed for 25 cycles (α-tubulin) and 35 cycles (SAMT1). (L) RNA gel blot analysis of SAMT1. Total RNA (10 μg) used was isolated using the lines shown in (K). Blots were hybridized with the probes used in (G). (M) Protein gel blot analysis of SAMT1 in wild-type and mutant lines as in (K). An equivalent amount of chloroplast proteins (50 μg) was immunologically probed with anti-SAMT1.
Figure 5.
Figure 5.
Plastid SAM Uptake and Endogenous Concentration of SAM. (A) Plastid uptake was estimated after incubation of isolated chloroplasts with 200 μM [14C]SAM for 1 min. The 100% transport was 375 pmol·mg−1 protein·min−1. Chloroplasts were isolated from wild-type (Col-0), samt1, and complemented (samt1/35S-SAMT1) lines. (B) Concentration of plastid SAM. The 100% value was 215 pmol/mg protein. Wild-type (Col-0), samt1, and complemented (samt1/35S-SAMT1) lines were analyzed. Values shown are from two independent experiments that gave similar results.
Figure 6.
Figure 6.
Pigment and Prenyllipid Contents of Wild-Type (Col-0) and samt1 Plants. (A) Total carotenoid (CAR) and chlorophyll (CHL) contents of wild-type (Col-0) and samt1 plants. (B) Total α-tocopherol (α-T), γ-tocopherol (γ-T), plastoquinone-9 (PQ9), and phylloquinone (K1) contents of wild-type (Col-0) and samt1 plants. (C) Rosette leaves were detached and incubated with 5 mM 5-aminolevulinate (ALA) for 12 h in the dark before determination of MgProto IX and MgProto IX Me contents. Total lipids were extracted from 3-week-old plants and subjected to chromatographic analysis. Values represent means ± sd from three independent analyses. FW, fresh weight.
Figure 7.
Figure 7.
Virus-Induced Gene Silencing of N. benthamiana SAMT1 (Nb SAMT1). (A) N. benthamiana plants infected with TTO-Nb SAMT1 were photographed at 21 d after inoculation. (B) Uninfected N. benthamiana plants were photographed at 21 d after inoculation. (C) and (D) N. benthamiana plants infected with TTO-Nb SAMT1 (C) or TTO-CrtB (D) used as a control were photographed at 21 d after inoculation. (E) RT-PCR analysis of the transcript level of Nb SAMT1. Primers annealing outside of the TTO-Nb SAMT1 construct were used. The expression of α-tubulin was used as a control. Upper uninoculated leaves from three independent plants were used to determine Nb SAMT1 mRNA levels in TTO-Nb SAMT1 (A), TTO-CrtB (D), and uninfected (B) plants. PCR was performed for 25 cycles (α-tubulin) and 32 cycles (Nb SAMT1). (F) RNA gel blot analysis was performed using total RNA (10 μg) isolated from the same plants described for (E). Blots were hybridized with Nb SAMT1 probe and 18S rRNA probe to verify equivalent sample loading.
Figure 8.
Figure 8.
Pigment and Prenyllipid Contents of Uninfected, TTO-CrtB, and TTO-Nb SAMT1–Silenced Plants. (A) Total carotenoid (CAR) and chlorophyll (CHL) contents. (B) Total α-tocopherol (α-T), γ-tocopherol (γ-T), plastoquinone-9 (PQ9), and phylloquinone (K1) contents. (C) Upper noninoculated leaves were detached and incubated with 5 mM 5-aminolevulinate (ALA) for 12 h in the dark before determination of MgProto IX and MgProto IX Me contents. Total lipids were extracted from 3-week-old plants and subjected to chromatographic analysis. Values represent means ± sd from three independent analyses. FW, fresh weight.

References

    1. Aarnes, H. (1978). Regulation of threonine biosynthesis in barley seedlings (Hordeum vulgare L.). Planta 140 185–192. - PubMed
    1. Agrimi, G., Di Noia, M.A., Marobbio, C.M., Fiermonte, G., Lasorsa, F.M., and Palmieri, F. (2004). Identification of the human mitochondrial S-adenosylmethionine transporter: Bacterial expression, reconstitution, functional characterization and tissue distribution. Biochem. J. 379 183–190. - PMC - PubMed
    1. Alawady, A.E., and Grimm, B. (2005). Tobacco Mg protoporphyrin IX methyltransferase is involved in inverse activation of Mg porphyrin and protoheme synthesis. Plant J. 41 282–290. - PubMed
    1. Alonso, J.M., et al. (2003). Genome-wide insertional mutagenesis of Arabidopsis thaliana. Science 301 653–657. - PubMed
    1. Altschul, S.F., Madden, T.L., Schäffer, A.A., Zhang, J., Zhang, Z., Miller, W., and Lipman, D.J. (1997). Gapped BLAST and PSI-BLAST: A new generation of protein database search programs. Nucleic Acids Res. 25 3389–3402. - PMC - PubMed

Publication types

MeSH terms

Associated data