. 2006 Nov 21;103(47):17807-12.
doi: 10.1073/pnas.0608512103. Epub 2006 Nov 10.

Transcription factor profiling in individual hematopoietic progenitors by digital RT-PCR

Affiliations

Transcription factor profiling in individual hematopoietic progenitors by digital RT-PCR

Luigi Warren et al. Proc Natl Acad Sci U S A. .

Abstract

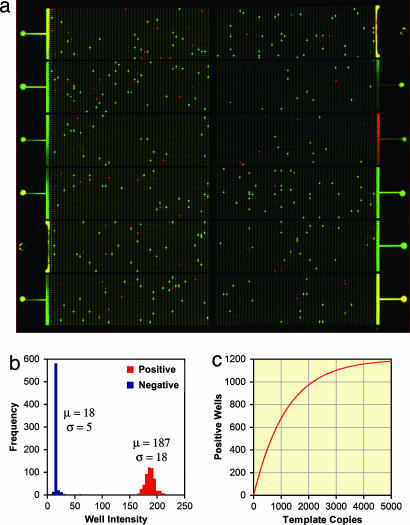
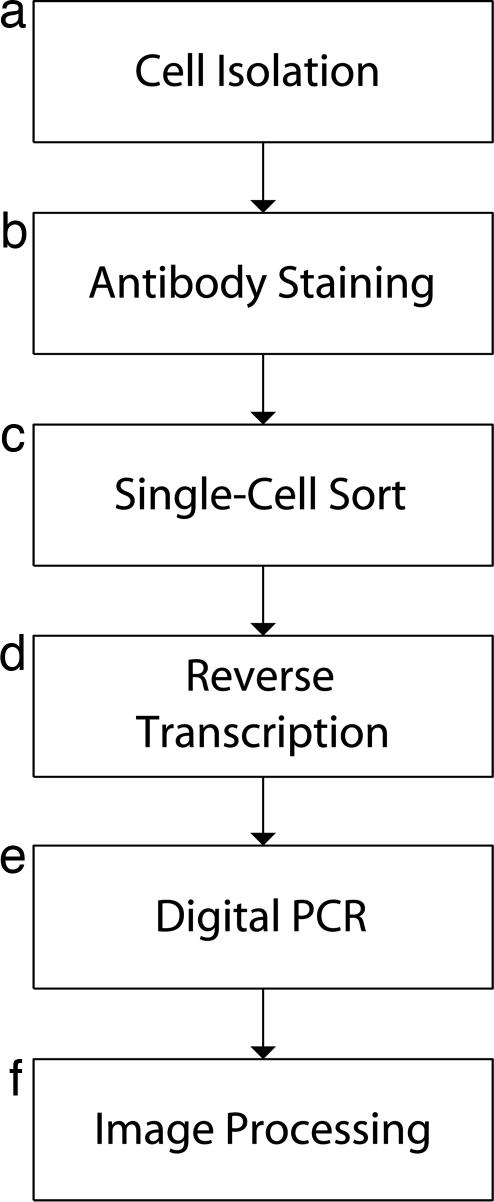
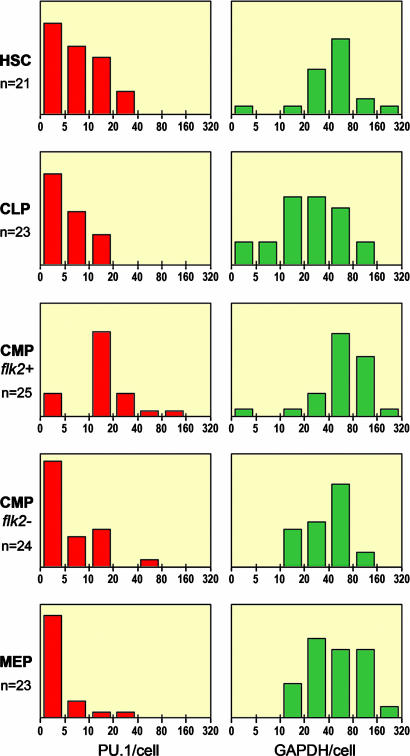
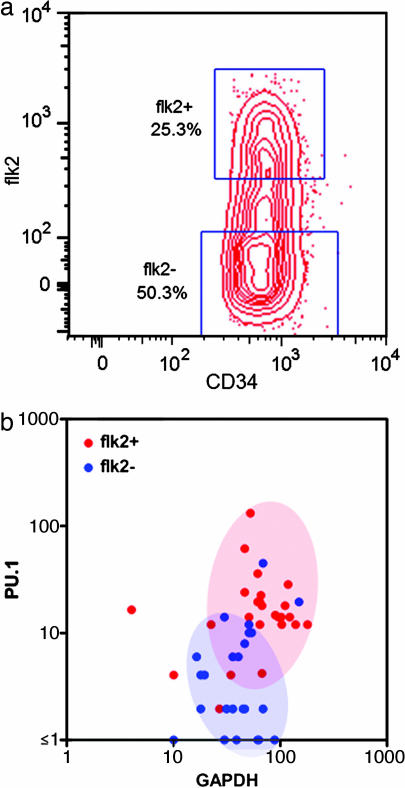
We report here a systematic, quantitative population analysis of transcription factor expression within developmental progenitors, made possible by a microfluidic chip-based "digital RT-PCR" assay that can count template molecules in cDNA samples prepared from single cells. In a survey encompassing five classes of early hematopoietic precursor, we found markedly heterogeneous expression of the transcription factor PU.1 in hematopoietic stem cells and divergent patterns of PU.1 expression within flk2- and flk2+ common myeloid progenitors. The survey also revealed significant differences in the level of the housekeeping transcript GAPDH across the surveyed populations, which demonstrates caveats of normalizing expression data to endogenous controls and underscores the need to put gene measurement on an absolute, copy-per-cell basis.


Conflict of interest statement

Conflict of interest statement: S.Q. is a founder, shareholder, and consultant for Fluidigm Corporation.

Figures

Fig. 1.
Fig. 1.
The Digital Array chip. (a) A PCR end-point scan of a chip. In this false-color image, the FAM signal (GAPDH) is shown in green and the Cy5 signal (PU.1) is shown in red. The 12 samples analyzed here correspond to cDNA preparations derived from individual HSCs. Within a sample panel, 7.5 μl of analyte is partitioned into 1,200 isolated reaction chambers (“wells”) before PCR. At the cDNA concentrations encountered in the single-cell survey, almost all wells capture either zero or one template molecules; after PCR, the count of high-intensity wells provides a readout of the number of template molecules in the original, unamplified sample. (b) Histogram of well intensities within a single Digital Array panel after 40 cycles of PCR. The analyte was cDNA reverse-transcribed from PU.1 runoff transcript. Positive/negative calls are based on an operator-defined threshold. (c) Digital PCR response characteristic. In the digital assay, positive reactions signal compartments capturing one or more template molecules at the start of the PCR. At high template concentrations, a significant fraction of compartments start out with multiple template copies and the response curve becomes increasingly nonlinear. For a panel with n compartments, the number of input molecules, x, can be computed from the readout of positive compartments, y, by using the equation x = log(1 − y/n)/log(1 − 1/n) (Supporting Text).
Fig. 2.
Fig. 2.
Experimental procedure used in the single-cell survey. (a) Cells are harvested from mouse bone marrow, then enriched for c-kit+ early progenitors by immunomagnetic separation. (b) Purified cells are stained with a panel of fluorescent antibodies to surface proteins whose expression patterns define progenitor types of interest. (c) FACS is used to dispense individual immunophenotyped cells into RT-PCR buffer, where they undergo hypotonic/detergent lysis, releasing their mRNA. (d) Gene-specific primers and probes, reverse transcriptase, and DNA polymerase are added to the lysates, and the samples are reverse-transcribed in a standard thermocycler. (e) Completed reactions are loaded into the digital PCR chip, which is pneumatically partitioned and thermocycled on a flat block. (f) End-point fluorescence images of the chip are processed to read out the levels of the transcripts targeted by the TaqMan assays.
Fig. 3.
Fig. 3.
Gene expression in cDNA copies per cell, by cell type. The histograms show the number of individual cells in each subset that expressed PU.1 and GAPDH within the indicated bin ranges. PU.1 expression is heterogeneous in the stem cells, up-regulated in the CMP/flk2+ cells, down-regulated in CMP/flk2 cells, and sharply down-regulated in the MEPs. The similarity between PU.1 expression in CMP/flk2 and MEP cells is consistent with the possibility that flk2 CMPs are already biased toward the MEP lineage choice. GAPDH expression was significantly elevated in the CMP/flk2+ cells, adding weight to the inference that the flk2 and flk2+ CMP subpopulations are functionally distinct.
Fig. 4.
Fig. 4.
Resolution of flk2 and flk2+ CMP populations based on gene expression. (a) The sort gates used to fractionate CMP cells into flk2+ and flk2 subsets (biexponential plot). These gates were applied after first selecting Lineage c-kit+ ScaIlo IL7R CD34+ FcGrlo cells. (b) The distribution of GAPDH and PU.1 expression in the flk2+ and flk2 CMP subsets, as determined by single-cell analysis. The shaded ellipsoids capture >85% of the observations within each set.

References

    1. Sprinzak D, Elowitz MB. Nature. 2005;438:443–448. - PubMed
    1. Revilla-i-Domingo R, Davidson EH. Int J Dev Biol. 2003;47:695–703. - PubMed
    1. Gilman A, Arkin AP. Annu Rev Genomics Hum Genet. 2002;3:341–369. - PubMed
    1. Dixon AK, Richardson PJ, Pinnock RD, Lee K. Trends Pharmacol Sci. 2000;21:65–70. - PubMed
    1. Vogelstein B, Kinzler KW. Proc Natl Acad Sci USA. 1999;96:9236–9241. - PMC - PubMed

Publication types

MeSH terms

Substances