

Acid tolerance of Streptococcus macedonicus as assessed by flow cytometry and single-cell sorting
- PMID: 17098924
- PMCID: PMC1796968
- DOI: 10.1128/AEM.01244-06
Acid tolerance of Streptococcus macedonicus as assessed by flow cytometry and single-cell sorting
Abstract
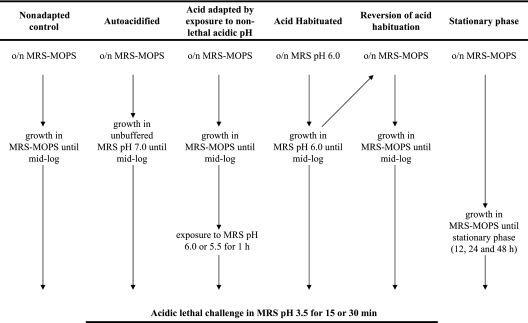
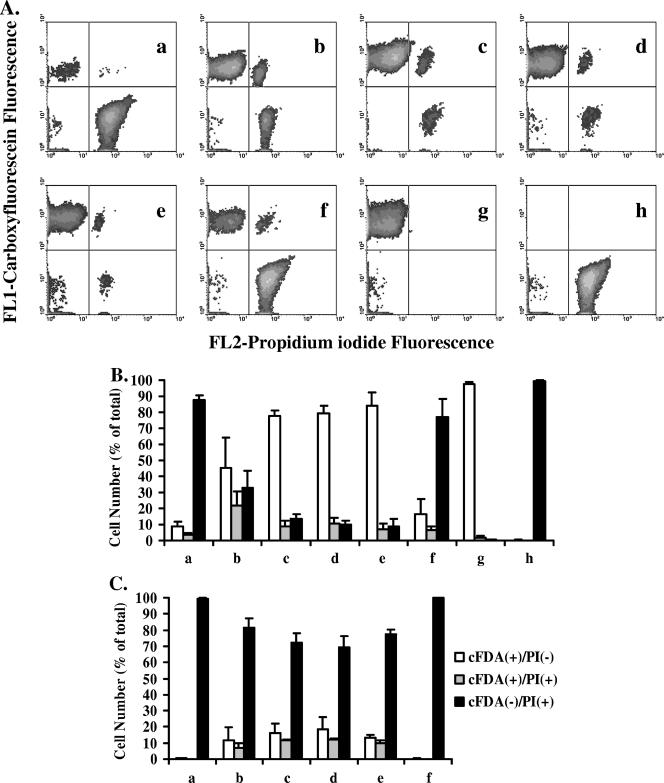
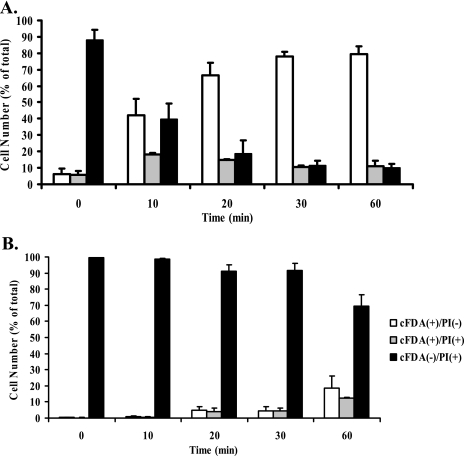
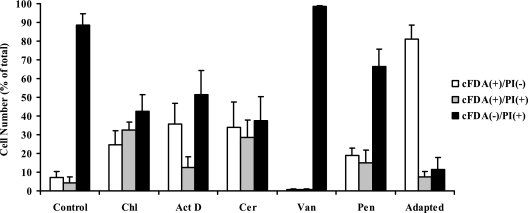
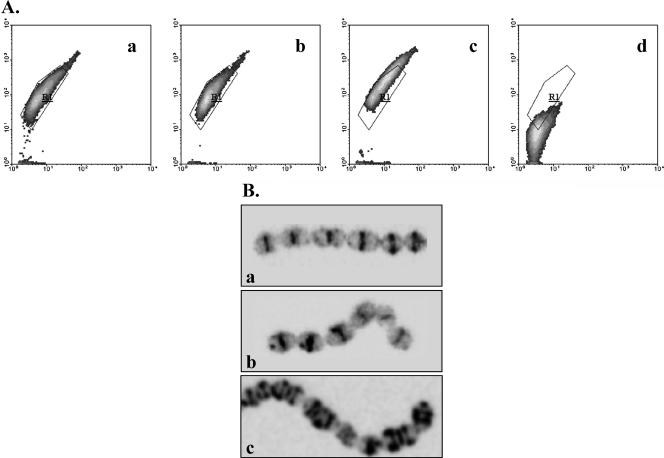
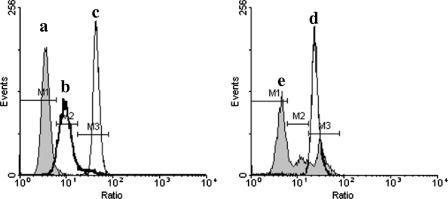
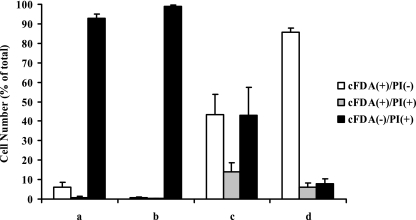
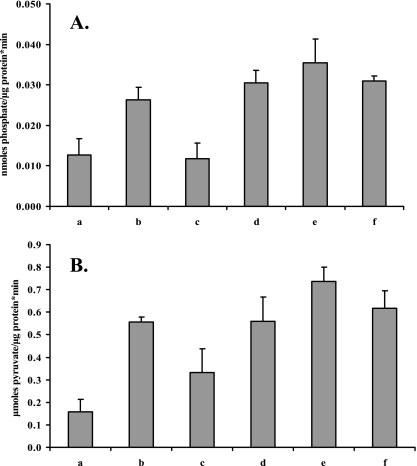
An in situ flow cytometric viability assay employing carboxyfluorescein diacetate and propidium iodide was used to identify Streptococcus macedonicus acid tolerance phenotypes. The logarithmic-phase acid tolerance response (L-ATR) was evident when cells were (i) left to autoacidify unbuffered medium, (ii) transiently exposed to nonlethal acidic pH, or (iii) systematically grown under suboptimal acidic conditions (acid habituation). Stationary-phase ATR was also detected; this phenotype was gradually degenerated while cells resided at this phase. Single-cell analysis of S. macedonicus during induction of L-ATR revealed heterogeneity in both the ability and the rate of tolerance acquisition within clonal populations. L-ATR was found to be partially dependent on de novo protein synthesis and compositional changes of the cell envelope. Interestingly, acid-habituated cells were interlaced in lengthier chains and exhibited an irregular pattern of active peptidoglycan biosynthesis sites when probed with BODIPY FL vancomycin. L-ATR caused cells to retain their membrane potential after lethal challenge, as judged by ratiometric analysis with oxonol [DiBAC(4)(3)]. Furthermore, F-ATPase was important during the induction of L-ATR, but in the case of a fully launched response, inhibition of F-ATPase affected acid resistance only partially. Activities of both F-ATPase and the glucose-specific phosphoenolpyruvate-dependent phosphotransferase system were increased after L-ATR induction, distinguishing S. macedonicus from oral streptococci. Finally, the in situ viability assessment was compared to medium-based recovery after single-cell sorting, revealing that the culturability of subpopulations with identical fluorescence characteristics is dependent on the treatments imposed to the cells prior to acid challenge.
Figures
Similar articles
-
RNA arbitrarily primed PCR and fourier transform infrared spectroscopy reveal plasticity in the acid tolerance response of Streptococcus macedonicus.Appl Environ Microbiol. 2008 Oct;74(19):6068-76. doi: 10.1128/AEM.00315-08. Epub 2008 Aug 8. Appl Environ Microbiol. 2008. PMID: 18689510 Free PMC article.
-
Rapid assessment of the physiological status of Streptococcus macedonicus by flow cytometry and fluorescence probes.Int J Food Microbiol. 2006 Oct 1;111(3):197-205. doi: 10.1016/j.ijfoodmicro.2006.04.042. Epub 2006 Aug 24. Int J Food Microbiol. 2006. PMID: 16934355
-
Effect of carbon starvation and proteolytic activity on stationary-phase acid tolerance of Streptococcus mutans.Microbiology (Reading). 2001 Nov;147(Pt 11):2971-9. doi: 10.1099/00221287-147-11-2971. Microbiology (Reading). 2001. PMID: 11700348
-
Adaptive acid tolerance response of Streptococcus sobrinus.J Bacteriol. 2004 Oct;186(19):6383-90. doi: 10.1128/JB.186.19.6383-6390.2004. J Bacteriol. 2004. PMID: 15375118 Free PMC article.
-
Low pH adaptation and the acid tolerance response of Salmonella typhimurium.Crit Rev Microbiol. 1995;21(4):215-37. doi: 10.3109/10408419509113541. Crit Rev Microbiol. 1995. PMID: 8688153 Review.
Cited by
-
RNA arbitrarily primed PCR and fourier transform infrared spectroscopy reveal plasticity in the acid tolerance response of Streptococcus macedonicus.Appl Environ Microbiol. 2008 Oct;74(19):6068-76. doi: 10.1128/AEM.00315-08. Epub 2008 Aug 8. Appl Environ Microbiol. 2008. PMID: 18689510 Free PMC article.
-
Adaptation in Bacillus cereus: From Stress to Disease.Front Microbiol. 2016 Oct 4;7:1550. doi: 10.3389/fmicb.2016.01550. eCollection 2016. Front Microbiol. 2016. PMID: 27757102 Free PMC article. Review.
-
Evolution of microbiological analytical methods for dairy industry needs.Front Microbiol. 2014 Feb 7;5:16. doi: 10.3389/fmicb.2014.00016. eCollection 2014. Front Microbiol. 2014. PMID: 24570675 Free PMC article. Review.
-
Carolacton Treatment Causes Delocalization of the Cell Division Proteins PknB and DivIVa in Streptococcus mutans in vivo.Front Microbiol. 2016 May 11;7:684. doi: 10.3389/fmicb.2016.00684. eCollection 2016. Front Microbiol. 2016. PMID: 27242711 Free PMC article.
-
Changes in Chemical Composition of Lentils, Including Gamma-Aminobutyric Acid and Volatile Compound Formation during Submerged and Solid-State Fermentation with Pediococcus acidilactici.Foods. 2024 Apr 19;13(8):1249. doi: 10.3390/foods13081249. Foods. 2024. PMID: 38672920 Free PMC article.
References
-
- Alemayehu, D., E. O'Sullivan, and S. Condon. 2000. Changes in acid tolerance of Lactococcus lactis during growth at constant pH. Int. J. Food Microbiol. 55:215-221. - PubMed
-
- Amor, K. B., P. Breeuwer, P. Verbaarschot, F. M. Rombouts, A. D. Akkermans, W. M. De Vos, and T. Abee. 2002. Multiparametric flow cytometry and cell sorting for the assessment of viable, injured, and dead bifidobacterium cells during bile salt stress. Appl. Environ. Microbiol. 68:5209-5216. - PMC - PubMed
-
- Bolotin, A., B. Quinquis, P. Renault, A. Sorokin, S. D. Ehrlich, S. Kulakauskas, A. Lapidus, E. Goltsman, M. Mazur, G. D. Pusch, M. Fonstein, R. Overbeek, N. Kyprides, B. Purnelle, D. Prozzi, K. Ngui, D. Masuy, F. Hancy, S. Burteau, M. Boutry, J. Delcour, A. Goffeau, and P. Hols. 2004. Complete sequence and comparative genome analysis of the dairy bacterium Streptococcus thermophilus. Nat. Biotechnol. 22:1554-1558. - PMC - PubMed
-
- Bonn, D. 2003. New bacteriocin from Greek cheese. Lancet Infect. Dis. 3:61. - PubMed
Publication types
MeSH terms
Substances
LinkOut - more resources
Full Text Sources
Miscellaneous
