

doi: 10.1186/gb-2006-7-11-r106.
Analysis of the Saccharomyces cerevisiae proteome with PeptideAtlas
Affiliations
- PMID: 17101051
- PMCID: PMC1794584
- DOI: 10.1186/gb-2006-7-11-r106
Item in Clipboard
Analysis of the Saccharomyces cerevisiae proteome with PeptideAtlas
Genome Biol.
2006.
Abstract
We present the Saccharomyces cerevisiae PeptideAtlas composed from 47 diverse experiments and 4.9 million tandem mass spectra. The observed peptides align to 61% of Saccharomyces Genome Database (SGD) open reading frames (ORFs), 49% of the uncharacterized SGD ORFs, 54% of S. cerevisiae ORFs with a Gene Ontology annotation of 'molecular function unknown', and 76% of ORFs with Gene names. We highlight the use of this resource for data mining, construction of high quality lists for targeted proteomics, validation of proteins, and software development.
Figures

PeptideAtlas processing, creation, and interfaces. The first column outlines experiment level processing with SEQUEST [21] and PeptideProphet [22], the second column shows major stages in the construction of a PeptideAtlas [18] using BLAST [24] to obtain coding sequence (CDS) coordinates, and the third column shows the data, business logic, and presentation tiers for a PeptideAtlas.

Histrograms of protein sequence coverage. A histogram of the sequence coverage of the S. cerevisiae ORFs by PeptideAtlas (darker filled bars) and an in silico tryptic digestion of the reference protein database with a mass range of 500 to 4,000 Da (lighter diagonal pattern filled bars) is shown. Of the PeptideAtlas ORFs, 61% have coverage below 20%, while 39% have a coverage above 20%.
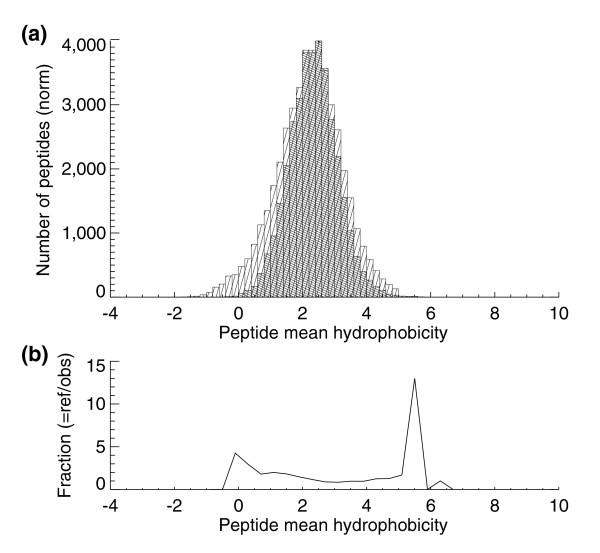
Hydrophobicity histrogams. (a) Mean hydrophobicity histogram for peptides in the S. cerevisiae PeptideAtlas (darker hashed bars) and an in silico tryptic digest of the SGD reference protein database allowing one missed cleavage (lighter hashed bars). (b) The reference peptides' hydrophobicities divided by the observed peptides' hydrophobicities. The lowest hydrophobicity peptides are generally washed off the column in the reverse phase stage of the HPLC process and hence not measured.

Mass histograms. (a) Average molecular weight of unique peptide sequences in PeptideAtlas (solid filled bars) and the in silico tryptically digested SGD protein database (hashed bars) allowing one missed cleavage. (b-d) Mass histograms of spectra, separated by charge. The large number of peptides with masses less than 1,000 Da are difficult to identify in database searches, and hence are not present in the PeptideAtlas. CID, collision-induced dissociation.

Cumulative number of MS/MS spectra versus the number of unique peptide identifications with P > 0.9. The slope is nearly horizontal in regions of the curve where similar experiments were performed. The curve is expected to show saturation when additional spectra provide no new peptides above P > 0.9. The number of distinct peptides from an in silico trypic digestion of the SGD protein database, allowing one missed cleavage, and counting those peptides whose masses are in the range 500 to 4,000 Da, is 436,445.
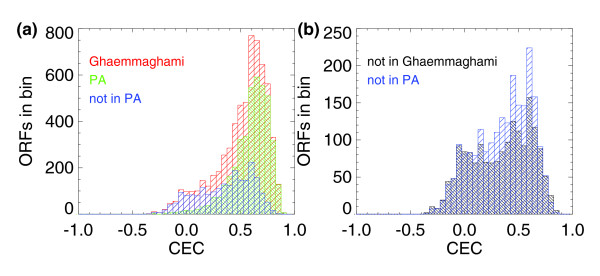
Comparison of codon enrichment correlation (CEC) distributions. (a) Histogram of CEC for all ORFs listed in Ghaemmaghami et al. [14], for all ORFs seen in PeptideAtlas (PA), and for all ORFs not seen in PeptideAtlas; and (b) histogram of CEC for ORFs not seen in the Ghaemmaghami et al. expression sets and for all ORFs not seen in PeptideAtlas. Observed proteins in PeptideAtlas and in Ghaemmaghami et al. show a positive skew in CEC showing that they deviate significantly from that expected from a random sequence of codons, while the unobserved proteins show more uniformly distributed CEC values.
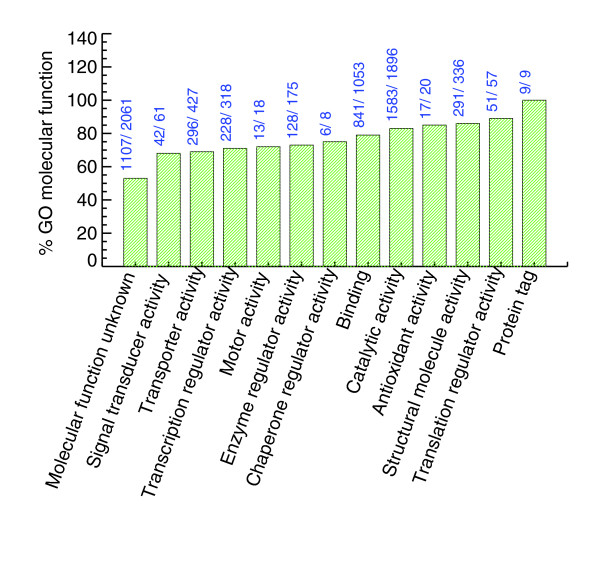
The number of genes identified in GO Molecular Function terms (more specifically, the first level children of molecular function). The bars are annotated with the number of SGD genes annotated in that term and the number of SGD genes seen in PeptideAtlas for that term. Many annotated as unknown are present in the PeptideAtlas.
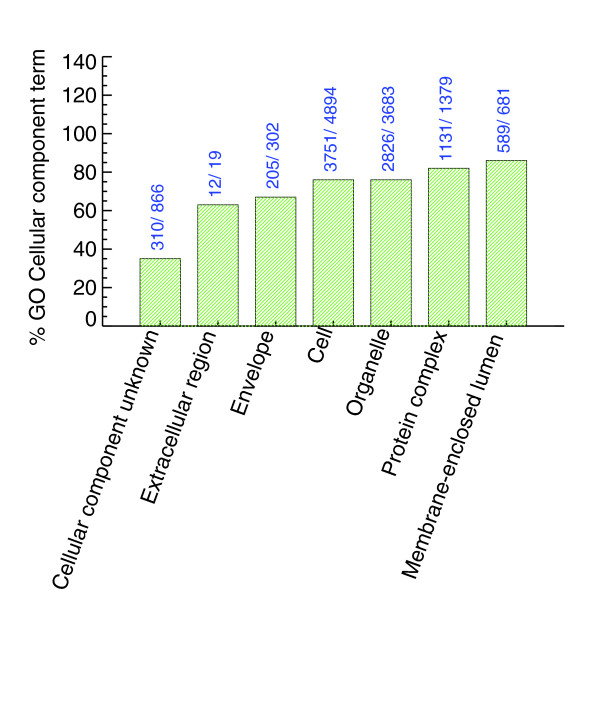
The number of genes identified in GO Cellular Component terms (more specifically, the first level children). The bars are annotated with the number of SGD genes and the number of SGD genes in PeptideAtlas for that term. Many annotated as unknown are present in the PeptideAtlas.

The number of genes identified in GO Biological Process terms (more specifically, the first level children). The bars are annotated with the number of SGD genes and the number of SGD genes in PeptideAtlas for that term.
References
-
- Sonenberg N, Hershey WB, Mathews MB. Translational Control of Gene Expression (Cold Spring Harbor Monograph) Cold Spring Harbor: Cold Spring Harbor Laboratory Press; 2001.
Publication types
MeSH terms
Substances
Grants and funding
LinkOut - more resources
Full Text Sources
Molecular Biology Databases
