. 2007 Feb;27(3):1096-111.
doi: 10.1128/MCB.01750-06. Epub 2006 Nov 13.

Structural and mechanistic features of protein O glycosylation linked to CD8+ T-cell apoptosis

Affiliations

Structural and mechanistic features of protein O glycosylation linked to CD8+ T-cell apoptosis

Steven J Van Dyken et al. Mol Cell Biol. 2007 Feb.

Abstract

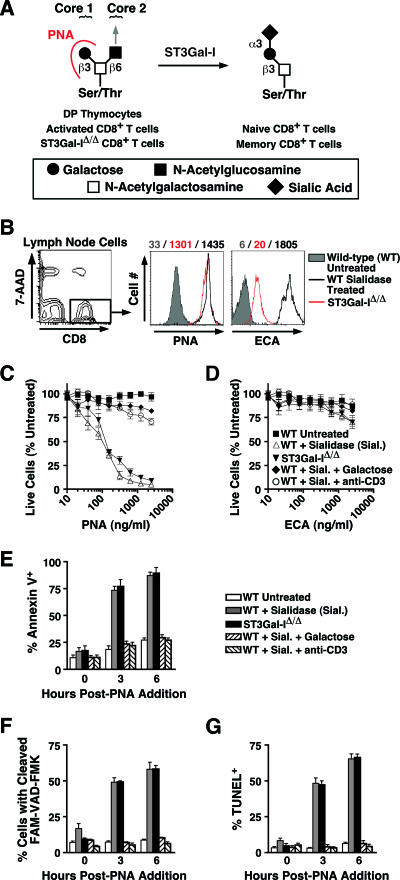
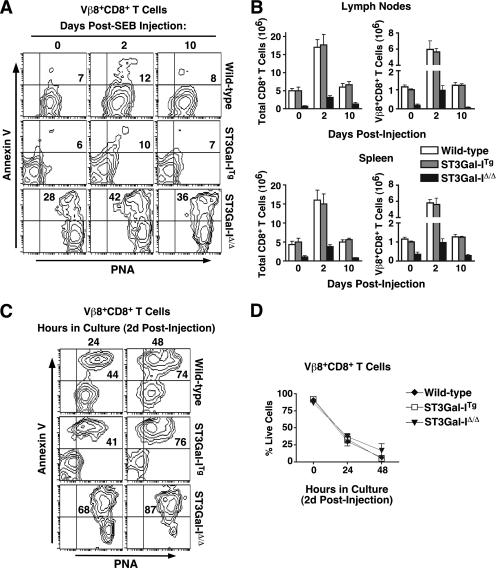
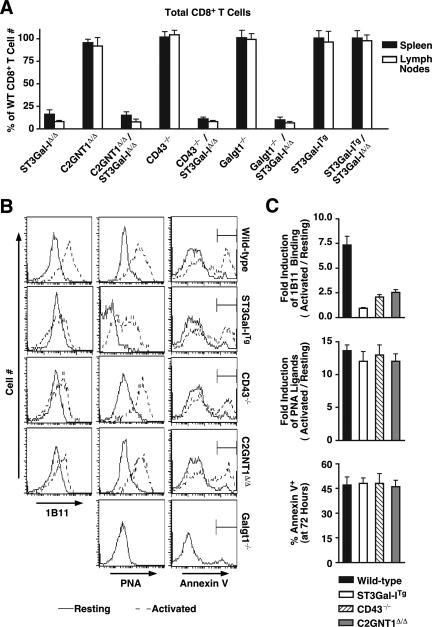
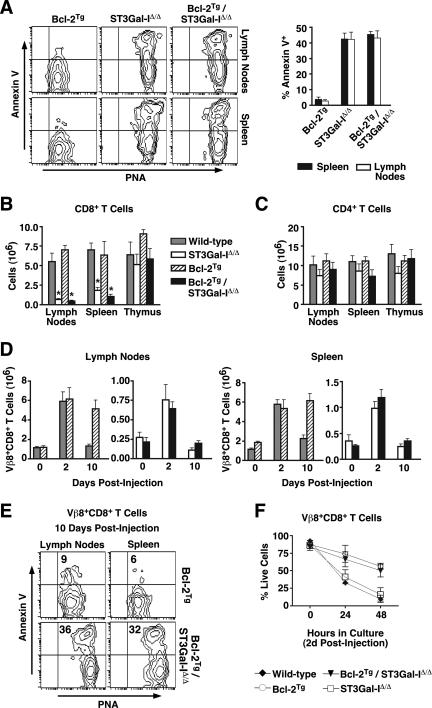
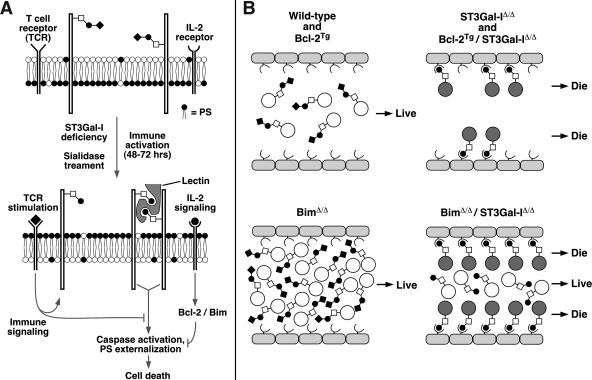
CD8+ T-cell apoptosis is essential for the contraction phase of the immune response, yet the initiating signals and precise pathways involved are unresolved. The ST3Gal-I sialyltransferase is a candidate mechanistic component and catalyzes sialic acid addition to core 1 O-glycans during protein O glycosylation. ST3Gal-I inactivation or enzymatic removal of its product renders CD8+ T cells, but not CD4+ T cells, susceptible to apoptosis by differential cross-linking of O-glycoproteins in the absence of interleukin-2 and T-cell receptor (TCR) signaling. This results in caspase activation, DNA fragmentation, and phosphatidylserine externalization prior to cell death. We further show that ST3Gal-I function is regulated by a posttranscriptional mechanism operating distal to Golgi core 2 O glycosylation and is invariably linked to CD8+ T-cell contraction following viral (lymphocytic choriomeningitis virus) infection and bacterial (staphylococcal enterotoxin B) antigen immunization. The mechanism does not involve the ST3Gal-I substrate CD43 or core 2 O-glycan induction and overcomes the ability of Bcl-2 to inhibit the contraction phase in vivo. Loss of ST3Gal-I function further reduces Bim-deficient CD8+ T-cell accumulation without diminishing apoptotic sensitivity. We propose that an endogenous lectin activates an apoptotic pathway constructed in CD8+ T cells following TCR stimulation and enables contraction upon attenuation of immune signaling.


Figures

FIG. 1.
FIG. 1.
O-glycan structures and sialidase treatment sensitize wild-type CD8+ T cells to apoptotic death in vitro. (A) ST3Gal-I-dependent sialylation of the core 1 O-glycan Galβ1-3GalNAc-Ser/Thr can by monitored by differential PNA binding. Immature CD4/CD8 double-positive thymocytes and activated peripheral CD8+ T cells, as well as ST3Gal-IΔ/Δ CD8+ T cells, express the unsialylated core 1 O-glycan Galβ1-3GalNAc-Ser/Thr, which is the ligand for PNA lectin, whereas this structure is predominantly sialylated among wild-type naive and memory cells. The position of the core 2 branch and possible extension is indicated by an arrow. (B) Flow cytometric analysis of PNA and ECA ligand levels among live (7-AAD) wild-type CD8+ T cells treated with Vibrio cholerae sialidase, along with nontreated ST3Gal-IΔ/Δ CD8+ T cells. Mean fluorescence intensity values are indicated by the corresponding colored numbers. These cells were subsequently cultured for 24 h with PNA (C) or ECA (D) at the indicated concentrations. Cell counts are presented as percentages of live CD8+ T cells compared to control cultures not treated with sialidase or lectin. The percentage of cells among the live (7-AAD) cell population in culture 0, 3, and 6 h after addition of 1,000 ng/ml PNA positive for annexin V (E), active caspases, assessed by 6-carboxyfluorescein (FAM)-VAD-FMK cleavage (F), and DNA fragmentation, assessed by terminal deoxynucleotidyltransferase-mediated dUTP-biotin nick end labeling (TUNEL) assay was measured by flow cytometry (G). Data are presented as means ± standard errors of the means (n = 4).
FIG. 2.
FIG. 2.
Constitutive ST3Gal-I transgene expression in T-cell ontogeny and peripheral T-lymphocyte homeostasis. (A) ST3Gal-I transgene construct. The EcoRI fragment of human ST3Gal-I cDNA was inserted into the VA hCD2 minigene cassette, which contains the human CD2 promoter sequence. E, EcoRI; K, KpnI; X, XbaI. (B) Thymic tissue sections from ST3Gal-ITg animals and wild-type littermates reveal a loss of PNA ligands in both thymic cortex (C) and medulla (M) as a result of constitutive ST3Gal-I expression in T cells. (C) Total thymocyte subset numbers and frequencies among CD4/CD8 double-positive (DP), double-negative (DN), and SP T cells in ST3Gal-ITg and wild-type littermate mice. (D) TCR Vβ repertoire expression in ST3Gal-ITg and wild-type littermate CD8 SP thymocyte populations. (E) Analysis by flow cytometry indicates decreased PNA ligands on ST3Gal-ITg cells compared to littermate control cells among total thymocytes, CD8 SP thymocytes, and CD8+ T cells from spleen. (F) Total cell and CD8+ T-cell numbers in spleen and lymph nodes in ST3Gal-ITg and wild-type littermate animals. Data are presented as means ± standard errors of the means (n = 6). formula image
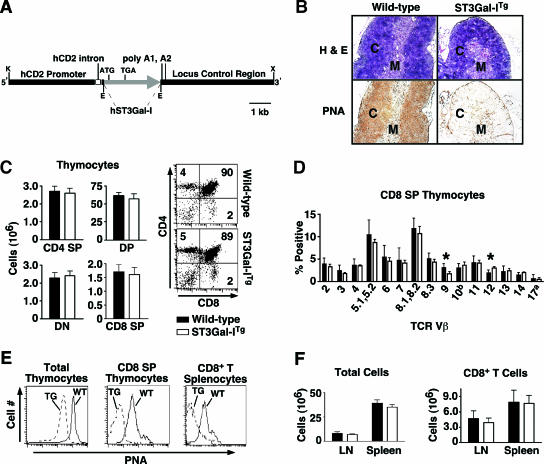
, statistically significant difference from wild-type littermates (P < 0.05, paired t test).
FIG. 3.
FIG. 3.
Annexin V induction in CD8+ T-cell apoptosis is linked to loss of core 1 O-glycan sialylation by a posttranscriptional mechanism. (A) CD8+ T cells from ST3Gal-ITg and littermate wild-type mice were activated in vitro with the indicated stimuli and analyzed for PNA ligand levels. Flow cytometry plots depict live (7-AAD) CD8+ T cells; numbers indicate percentages of cells in the upper right quadrant and are representative of results from three separate experiments. PNA ligand levels were assessed by flow cytometry among stimulated cells (at 72 h) and compared to unstimulated CD8+ T cells to calculate relative induction. aCD3, anti-CD3. (B) Percentage of live (7-AAD) annexin V+ CD8+ T cells at the indicated time points after activation with the indicated stimuli. (C) Reverse transcription-PCR analysis of ST3Gal-I transgene expression (normalized to 18s rRNA expression) was performed on purified CD8+ T cells isolated at 0, 24, 48, and 72 h post-anti-CD3 activation. The intensity ratio represents the ratio of ST3Gal-I transgene to 18S bands as assessed by densitometry.
FIG. 4.
FIG. 4.
Relationship of core 1 O-glycans structure to CD8+ T-cell apoptosis following an antiviral immune response in vivo. (A) Live (7-AAD) unstimulated CD8+ T cells (day 0) or gp33-41 tetramer-positive cells (days 8, 15, and 30) labeled with PNA and annexin V. Numbers indicate percentages of cells in the upper right quadrant and are representative of results from three separate experiments. PNA ligand levels were assessed by flow cytometry among gp33-41 tetramer-positive cells (days 8, 15, and 30 postinfection) and compared to unstimulated CD8+ T cells (day 0) to calculate relative induction. Total numbers of CD8+ T cells (left) and CD8+ T cells specific for Db gp33-41 MHC class I tetramers (right) in lymph nodes (B) and spleens (C) isolated from wild-type, ST3Gal-ITg, and ST3Gal-IΔ/Δ mice during LCMV infection are shown. Cells were enumerated by hemacytometer counts in combination with percentages obtained by flow cytometric analysis. Data are presented as means ± standard errors of the means (n = 3 to 6).
FIG. 5.
FIG. 5.
Relationship of core 1 O-glycan structure to CD8+ T-cell apoptosis following a bacterial antigen-driven immune response in vivo. (A) PNA ligands and annexin V reactivity were assessed by flow cytometry among live (7-AAD) Vβ8+ CD8+ T cells isolated from wild-type, ST3Gal-ITg, and ST3Gal-IΔ/Δ mice 0, 2, and 10 days post-SEB injection. (B) Total numbers of CD8+ and Vβ8+ CD8+ T cells from the lymph nodes and spleen of wild-type, ST3Gal-ITg, and ST3Gal-IΔ/Δ mice at 0, 2, and 10 days postinjection with SEB. Cells were enumerated by hemacytometer counts in combination with percentages obtained by flow cytometric analysis. (C) PNA ligands and annexin V reactivity were assessed by flow cytometry among live (7-AAD) Vβ8+ CD8+ T cells removed from wild-type, ST3Gal-ITg, and ST3Gal-IΔ/Δ mice 2 days post-SEB injection and analyzed after 24 or 48 h in culture. Numbers in panels A and C indicate percentages of cells in the upper right quadrant and are representative of results from three separate experiments. (D) Percentage of live (7-AAD) Vβ8+ CD8+ T cells during the 48 h in culture following isolation at 2 days post-SEB injection. Data in panels B and D are presented as means ± standard errors of the means (n = 3).
FIG. 6.
FIG. 6.
O-glycan structure, secretory pathway positioning, and protein- or lipid-linkage participation in CD8+ T-cell apoptosis. (A) Peripheral deficiency of CD8+ T cells observed in ST3Gal-I deficiency is rescued by transgenic expression of ST3Gal-I but is not altered in the absence of CD43, core 2 GlcNAcT-1 (C2GNT1), or Galgt1. Total CD8+ T-cell numbers in the lymph nodes and spleen are represented as a percentage of the number obtained from wild-type littermate mice. (B) Activation-induced formation of 1B11-reactive core 2 O-glycans is inhibited in ST3Gal-ITg CD8+, CD43−/−, and C2GNT1Δ/Δ CD8+ T cells; however, PNA ligands continue to appear coincident with the normal induction of apoptotic annexin V-positive cells. Histograms in panel B show live (7-AAD) CD8+ T cells in a resting state (solid lines) and 72 h post-anti-CD3 activation (dotted line; as described for Fig. 3). (C) Relative induction of 1B11 antibody binding and PNA ligands between resting and activated cells and percentages of annexin V+ cells are presented as means ± standard errors of the means (n = 3). Data in panel A are presented as means ± standard errors of the means (n = 6).
FIG. 7.
FIG. 7.
Loss of ST3Gal-I overcomes Bcl-2 expression to induce CD8+ T-cell apoptosis in vivo, but not in vitro, coincident with the expression of unsialylated core 1 O-glycans. (A) Flow cytometric analysis of live (7-AAD) CD8+ cells from the lymph nodes and spleens of wild-type, Bcl-2Tg, ST3Gal-IΔ/Δ, and Bcl-2Tg/ST3Gal-IΔ/Δ mice. Percentages of annexin V+ cells are shown in the graph at the right depicting means ± standard errors of the means (n = 4). Total numbers of CD8 (B) and CD4 (C) SP cells from the lymphoid tissues of wild-type, Bcl-2Tg, ST3Gal-IΔ/Δ, and Bcl-2Tg/ST3Gal-IΔ/Δ mice. (D) Total numbers of Vβ8+ CD8+ T cells from lymph nodes and spleens of indicated mice at 0, 2, and 10 days postinjection with SEB. (E) PNA ligands and annexin V reactivity were assessed by flow cytometry among live (7-AAD) Vβ8+ CD8+ T cells removed from Bcl-2Tg and Bcl-2Tg/ST3Gal-IΔ/Δ mice 10 days post-SEB injection. (F) Percentages of live (7-AAD) Vβ8+ CD8+ T cells during the 48 h in culture following isolation at 2 days post-SEB injection. In all cases, cells were enumerated by hemacytometer counts in combination with percentages obtained by flow cytometric analysis. Data are presented as means ± standard errors of the means (n = 6 [A to C] and n = 3 [D, F]). formula image
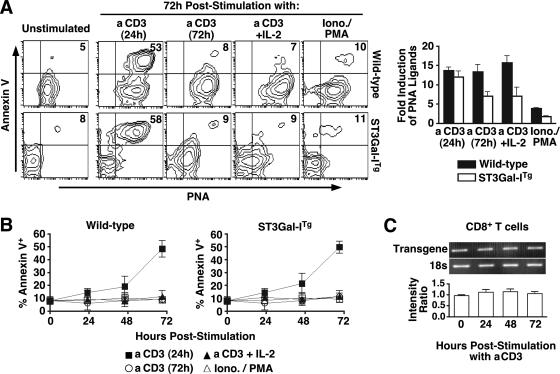
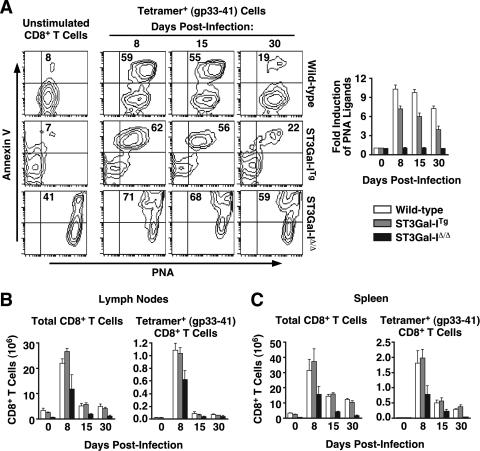
, statistically significant difference from wild-type littermates (P < 0.05, unpaired t test).
FIG. 8.
FIG. 8.
ST3Gal-I deficiency attenuates the accumulation of CD8+ T cells in the absence of Bim. (A) Flow cytometric analysis of live (7-AAD) CD8+ cells from the lymph nodes and spleens of wild-type, BimΔ/Δ, ST3Gal-IΔ/Δ, and BimΔ/Δ/ST3Gal-IΔ/Δ mice. The percentages of annexin V+ cells are shown in the graph at right depicting means ± standard errors of the means (n = 4). Total numbers of CD8 (B) and CD4 (C) SP cells from lymphoid tissues of wild-type, BimΔ/Δ, ST3Gal-IΔ/Δ, and BimΔ/Δ/ST3Gal-IΔ/Δ mice. (D) Total numbers of Vβ8+ CD8+ T cells from the lymph nodes and spleens of indicated mice at 0, 2, and 10 days postinjection with SEB. (E) PNA ligands and annexin V reactivity were assessed by flow cytometry among live (7-AAD) Vβ8+ CD8+ T cells removed from BimΔ/Δ and BimΔ/Δ/ST3Gal-IΔ/Δ mice 10 days post-SEB injection. (F) Percentages of live (7-AAD) Vβ8+ CD8+ T cells during the 48 h in culture following isolation at 2 days post-SEB injection. In all cases, cells were enumerated by hemacytometer counts in combination with percentages obtained by flow cytometric analysis. Data are presented as means ± standard errors of the means (n = 6 [A to C] and n = 3 [D, F]). formula image
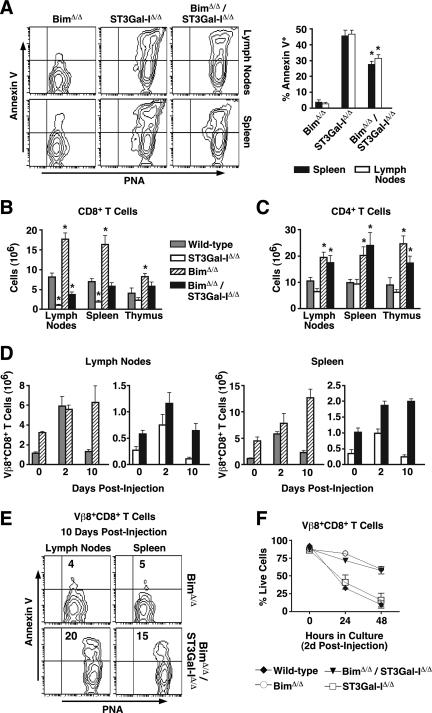
, statistically significant difference from ST3Gal-IΔ/Δ (in panel A) or wild-type littermates (in panels B and C) (P < 0.05, unpaired t test).
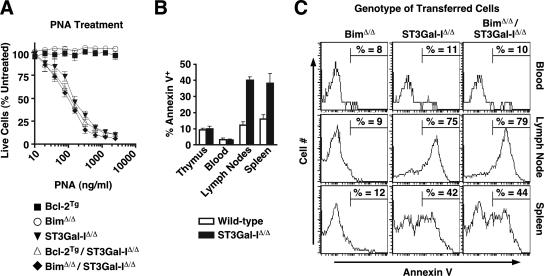
FIG. 9.
FIG. 9.
Dose-response induction of apoptosis and apoptotic CD8+ T-cell compartmentalization. (A) Cross-linking of the unsialylated core 1 O-glycan Galβ1-3GalNAcα-Ser/Thr induces death in ST3Gal-IΔ/Δ, Bcl-2Tg/ST3Gal-IΔ/Δ, or BimΔ/Δ/ST3Gal-IΔ/Δ, but not in Bcl-2Tg or BimΔ/Δ CD8+ T cells (incubated with PNA, as in Fig. 1C). Cell counts are presented as percentages (means ± standard errors of the means; n = 3) of live CD8+ T cells compared to control cultures not treated with lectin. (B) Percentages of CD8 SP T cells positive for annexin V upon isolation from the thymus, peripheral blood, lymph nodes, or spleen of ST3Gal-IΔ/Δ or wild-type littermate mice (means ± standard errors of the means; n = 3). (C) CD8 SP thymocytes isolated from the indicated mice were adoptively transferred into Rag1Δ/Δ recipients and recovered after 2 weeks from the peripheral blood, lymph nodes, or spleen, and the percentages of annexin V+ cells (gating shown) were assessed by flow cytometry.
FIG. 10.
FIG. 10.
Model of ST3Gal-I function in CD8+ T-cell apoptosis. (A) Absence of core 1 O-glycan sialylation by reduced ST3Gal-I function induces a glycan ligand for an endogenous multivalent lectin that cross-links specific O-glycoproteins bearing unsialylated core 1 O-glycans to induce apoptosis. TCR stimulation and IL-2 signaling block this apoptotic signal, which may partially overlap with Bcl-2 function but appears predominantly independent of Bcl-2 and Bim. PS, phosphatidylserine. (B) This may reflect the presence of limiting levels of an endogenous multivalent lectin expressed among peripheral lymphoid tissues. Levels of peripheral nonactivated CD8+ T cells in the various experimental genotypes reflect the presence or absence of O-glycan lectin ligands modulated by ST3Gal-I. A reduction of viable CD8+ T-cell numbers to those similar in wild-type mice is thereby achieved in the hyperaccumluation phenotype of Bim deficiency.

Similar articles

Cited by

References

    1. Amado, M., Q. Yan, E. M. Comelli, B. E. Collins, and J. C. Paulson. 2004. Peanut agglutinin high phenotype of activated CD8+ T cells results from de novo synthesis of CD45 glycans. J. Biol. Chem. 279:36689-36697. - PubMed
    1. Badovinac, V. P., A. R. Tvinnereim, and J. T. Harty. 2000. Regulation of antigen-specific CD8+ T cell homeostasis by perforin and interferon-γ. Science 290:1354-1357. - PubMed
    1. Badovinac, V. P., B. B. Porter, and J. T. Harty. 2004. CD8+ T cell contraction is controlled by early inflammation. Nat. Immunol. 5:809-817. - PubMed
    1. Bartholdy, C., J. P. Christensen, D. Wodarz, and A. R. Thomsen. 2000. Persistent virus infection despite chronic cytotoxic T-lymphocyte activation in gamma interferon-deficient mice infected with lymphocytic choriomeningitis virus. J. Virol. 74:10304-10311. - PMC - PubMed
    1. Bouillet, P., D. Metcalf, D. C. S. Huang, D. M. Tarlington, T. W. H. Kay, F. Köntgen, J. M. Adams, and A. Strasser. 1999. Proapoptotic Bcl-2 relative Bim required for certain apoptotic responses, leukocyte homeostasis, and to preclude autoimmunity. Science 286:1735-1738. - PubMed

Publication types

MeSH terms

LinkOut - more resources