

Transposon insertion site profiling chip (TIP-chip)
- PMID: 17101968
- PMCID: PMC1693798
- DOI: 10.1073/pnas.0605450103
Transposon insertion site profiling chip (TIP-chip)
Abstract
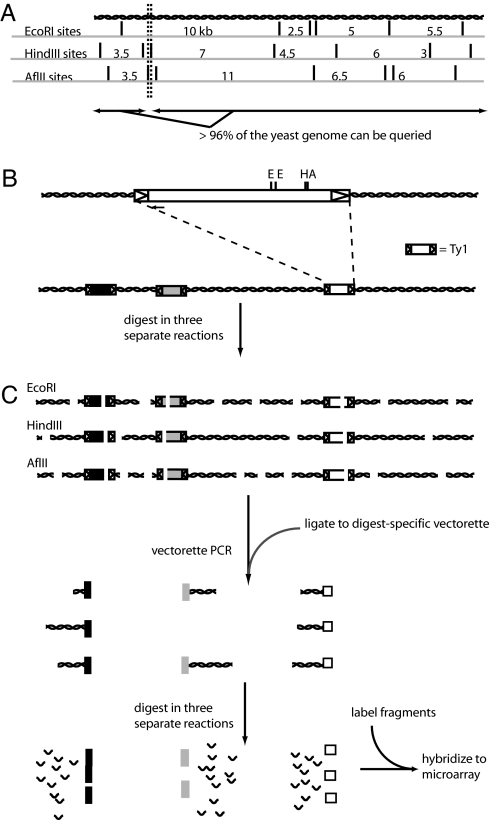
Mobile elements are important components of our genomes, with diverse and significant effects on phenotype. Not only can transposons inactivate genes by direct disruption and shuffle the genome through recombination, they can also alter gene expression subtly or powerfully. Currently active transposons are highly polymorphic in host populations, including, among hundreds of others, L1 and Alu elements in humans and Ty1 elements in yeast. For this reason, we wished to develop a simple genome-wide method for identifying all transposons in any given sample. We have designed a transposon insertion site profiling chip (TIP-chip), a microarray intended for use as a high-throughput technique for mapping transposon insertions. By selectively amplifying transposon flanking regions and hybridizing them to the array, we can locate all transposons present in a sample. We have tested the TIP-chip extensively to map Ty1 retrotransposon insertions in yeast and have achieved excellent results in two laboratory strains as well as in evolved Ty1 high-copy strains. We are able to identify all of the theoretically detectable transposons in the FY2 lab strain, with essentially no false positives. In addition, we mapped many new transposon copies in the high-copy Ty1 strain and determined its Ty1 insertion pattern.
Conflict of interest statement
The authors declare no conflict of interest.
Figures
Similar articles
-
Retrotransposon Ty1 integration targets specifically positioned asymmetric nucleosomal DNA segments in tRNA hotspots.Genome Res. 2012 Apr;22(4):693-703. doi: 10.1101/gr.129460.111. Epub 2012 Jan 4. Genome Res. 2012. PMID: 22219510 Free PMC article.
-
Ty1 insertions in intergenic regions of the genome of Saccharomyces cerevisiae transcribed by RNA polymerase III have no detectable selective effect.FEMS Yeast Res. 2004 Jan;4(4-5):487-91. doi: 10.1016/S1567-1356(03)00199-5. FEMS Yeast Res. 2004. PMID: 14734029
-
Ty1-copia elements reveal diverse insertion sites linked to polymorphisms among flax (Linum usitatissimum L.) accessions.BMC Genomics. 2016 Dec 7;17(1):1002. doi: 10.1186/s12864-016-3337-3. BMC Genomics. 2016. PMID: 27927184 Free PMC article.
-
The Ty1 LTR-Retrotransposon of Budding Yeast, Saccharomyces cerevisiae.Microbiol Spectr. 2015 Apr;3(2):MDNA3-0053-2014. doi: 10.1128/microbiolspec.MDNA3-0053-2014. Microbiol Spectr. 2015. PMID: 26104690 Review.
-
New lines of host defense: inhibition of Ty1 retrotransposition by Fus3p and NER/TFIIH.Trends Genet. 1999 Feb;15(2):43-5. doi: 10.1016/s0168-9525(98)01643-6. Trends Genet. 1999. PMID: 10098404 Review.
Cited by
-
Mobile element biology: new possibilities with high-throughput sequencing.Trends Genet. 2013 May;29(5):280-9. doi: 10.1016/j.tig.2012.12.002. Epub 2013 Jan 9. Trends Genet. 2013. PMID: 23312846 Free PMC article. Review.
-
Evolutionary genomics of transposable elements in Saccharomyces cerevisiae.PLoS One. 2012;7(11):e50978. doi: 10.1371/journal.pone.0050978. Epub 2012 Nov 30. PLoS One. 2012. PMID: 23226439 Free PMC article.
-
A high throughput screen for active human transposable elements.BMC Genomics. 2018 Feb 1;19(1):115. doi: 10.1186/s12864-018-4485-4. BMC Genomics. 2018. PMID: 29390960 Free PMC article.
-
Genome-wide analysis of intraspecific transposon diversity in yeast.BMC Genomics. 2013 Jun 14;14:399. doi: 10.1186/1471-2164-14-399. BMC Genomics. 2013. PMID: 23768249 Free PMC article.
-
Mobile element scanning (ME-Scan) identifies thousands of novel Alu insertions in diverse human populations.Genome Res. 2013 Jul;23(7):1170-81. doi: 10.1101/gr.148973.112. Epub 2013 Apr 18. Genome Res. 2013. PMID: 23599355 Free PMC article.
References
-
- Lander ES, Linton LM, Birren B, Nusbaum C, Zody MC, Baldwin J, Devon K, Dewar K, Doyle M, FitzHugh W, et al. Nature. 2001;409:860–921. - PubMed
-
- Waterston RH, Lindblad-Toh K, Birney E, Rogers J, Abril JF, Agarwal P, Agarwala R, Ainscough R, Alexandersson M, An P, et al. Nature. 2002;420:520–562. - PubMed
-
- Kim JM, Vanguri S, Boeke JD, Gabriel A, Voytas DF. Genome Res. 1998;8:464–478. - PubMed
-
- Messing J, Dooner HK. Curr Opin Plant Biol. 2006;9:157–163. - PubMed
Publication types
MeSH terms
Substances
Associated data
- Actions
Grants and funding
LinkOut - more resources
Full Text Sources
Other Literature Sources
Molecular Biology Databases
Miscellaneous
