. 2006 Nov 21;103(47):17991-6.
doi: 10.1073/pnas.0607603103. Epub 2006 Nov 13.

Na channel inactivation from open and closed states

Affiliations

Na channel inactivation from open and closed states

Clay M Armstrong. Proc Natl Acad Sci U S A. .

Abstract

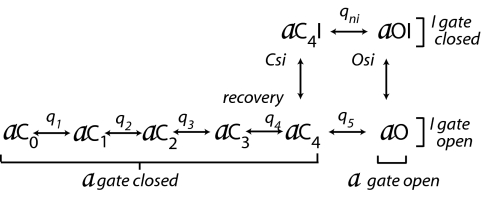
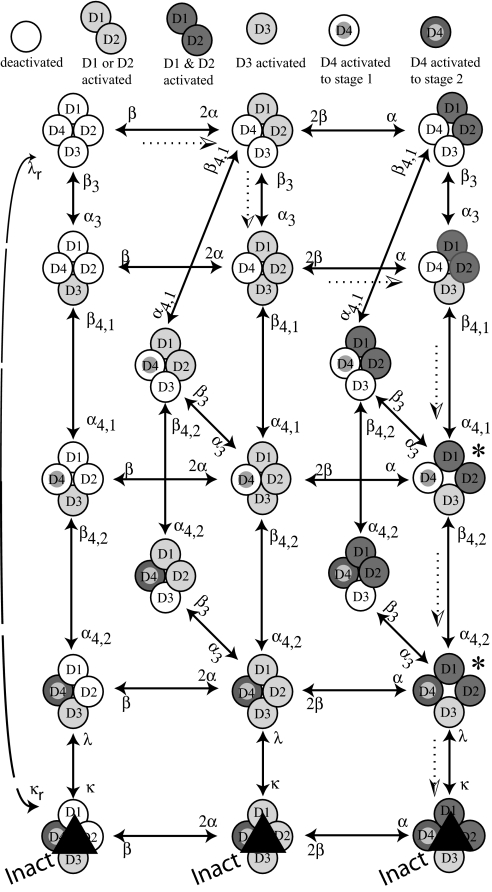
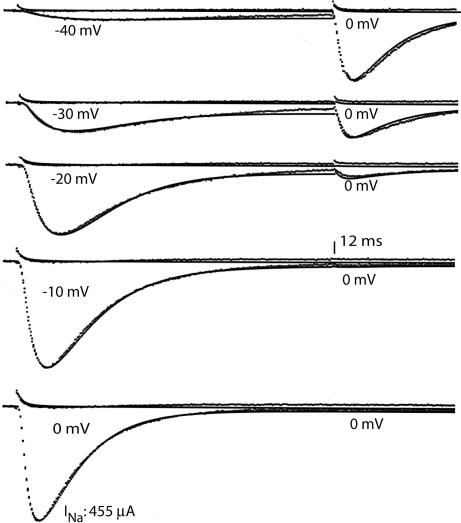
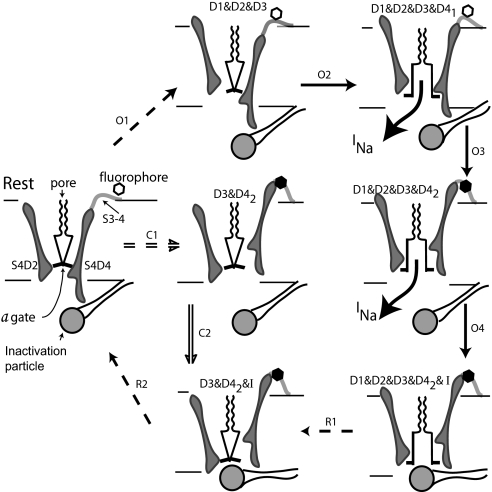
A sodium channel is composed of four similar domains, each containing a highly charged S4 helix that is driven outward (activates) in response to a depolarization. Functionally, the channel has two gates, called activation gate (a gate) and inactivation gate (I gate), both of which must be open for conduction to occur. The cytoplasmically located a gate opens after a depolarization has activated the S4s of (probably) all four domains. The I gate consists of a cytoplasmically located inactivation "particle" and a receptor for it in the channel. The receptor becomes available after some degree of S4 activation, and the particle diffuses in to inactivate the channel. The I gate usually closes when the a gate is open [open-state inactivation (Osi)] but also can close before the channel reaches the conducting state. This "closed-state inactivation" (Csi) is studied quantitatively in this paper to determine the degree of S4 activation required for (i) opening the a gate, and (ii) permitting the I gate to close. Csi is most prominent for small depolarizations, during which occupancy of the partially activated closed states is prolonged. Large depolarizations drive the S4s outward quickly, minimizing the duration of closed-state occupancy and making Csi small and Osi large. Based on these data and evidence in the literature, it is concluded that opening the a gate requires S4 activation in domains 1-3, with partial activation of the S4 of domain 4. Csi requires only S4 activation of domains 3 and 4, which does not open the a gate.


Conflict of interest statement

The author declares no conflict of interest.

Figures

Scheme 1.
Scheme 1.
Inactivation model, 1977.
Fig. 1.
Fig. 1.
Measuring inactivation and the slow component of activation. (A) (i) With IK largely suppressed, Ig and INa were measured during a 16-ms conditioning pulse from −90 to −30 mV, followed by a test pulse to 0 mV. (ii) After adding Tetrodotoxin, Ig and a small residual IK are visible. (iii) Subtracting ii from i leaves INa. Comparing i and ii during the test pulse to “control” (no conditioning pulse) shows that 78% of the channels inactivated during the pulse to −30 mV. The vertical dashed line shows that the fast component of Ig in trace ii is largely over before INa rises significantly (trace i-ii). (B) Ig and INa at higher resolution in a different experiment. The early part of the Ig trace is fitted with an exponential to elucidate a slower phase of Ig that temporally correlates with the rise of INa.
Fig. 2.
Fig. 2.
Measuring open- and closed-state inactivation. (A Lower) The lower traces show the fraction of Θpen channels (see Methods) for a 16-ms conditioning pulse (CP) to the indicated voltage. The peaks at the right show Θpen at 0 mV after a CP to the indicated voltage (see Fig. 1A for protocol). CP to −10, 0, or +10 mV causes complete inactivation. (A Upper) Time integrals of Θpen during the CP (lower left traces). The integral reaches a maximum in the range −10 to + 10 mV. This maximum is assigned the value 1.0 and is the Θpen-time integral required for all channels to inactivate via the open state. This value is used to calculate Osi and Csi (see Results). (B) Osi, Csi, and total (Inact) inactivation at three voltages as a function of CP duration.
Fig. 3.
Fig. 3.
Dividing inactivation into Osi and Csi. Osi was calculated by using the Θpen-time integral (Fig. 2A) for a 16-ms CP. Csi is the difference between Inactivation (total) and Osi. Csi/inactivation plots the fraction of total inactivation that results from Csi, near 1.0 at −60 mV and near 0 at 0 mV.
Fig. 4.
Fig. 4.
State diagram for activation and inactivation. A horizontal step represents activation (rightward movement) or deactivation (leftward movement) of D1 or D2, which are kinetically indistinguishable. A vertical step represents activation/deactivation of D3 (rate constants α33), first-stage activation of D4 (α4,14,1), second-stage activation of D4 (α4,24,2), or closing of the inactivation gate (κ/λ). The dotted arrows indicate the most probable path from fully deactivated (upper left corner) to inactivated at 0 mV. Conducting states are marked with asterisks.
Fig. 5.
Fig. 5.
The state diagram of Fig. 4 was fitted to Ig and INa, using rate constants in Table 2.
Fig. 6.
Fig. 6.
Channel activation and inactivation. At rest, the S4s of all domains are fully deactivated, forced inward by negative Vm. This pinches closed the a gate at the inner end of the pore. The scallops represent the selectivity filter. Path O: On depolarizing to 0 mV, the most likely path is shown by arrows O1–O4, with dashed arrows indicating multiple steps. Conduction begins when all four domains are activated, with D4 activated to stage 1. Stage 2 activation of D4 removes the steric hindrance that prevents closing of the inactivation gate and quenches fluorescence of the tag attached to the S3–4 linker of D4. Path C: At −30 mV, paths C and O are equally probable. After step C1, the a gate is held closed by D1 and D2, which are not activated, but inactivation is possible because D3 and D4 are activated, the latter to stage 2. The inactivation gate closes in step C2. Recovery: Steps R1 close the a gate as D1 and D2 deactivate, generating the inactivation resistant component of Ig. During step R2, negative Vm drives the S4s of D3 and D4 inward, the latter forcing the inactivation particle out of blocking position.

References

    1. Hodgkin AL, Huxley AF. J Physiol (London) 1952;117:500–544. - PMC - PubMed
    1. Bezanilla F, Armstrong CM. J Gen Physiol. 1977;70:549–566. - PMC - PubMed
    1. Armstrong CM, Bezanilla F. J Gen Physiol. 1977;70:567–590. - PMC - PubMed
    1. Armstrong CM, Gilly WF, editors. J Gen Physiol. 1979;74:691–711. - PMC - PubMed
    1. Aldrich RW, Corey DP, Stevens CF. Nature. 1983;306:436–441. - PubMed

Substances

LinkOut - more resources