. 2006:2:58.
doi: 10.1038/msb4100101. Epub 2006 Nov 14.

A novel computational model of the circadian clock in Arabidopsis that incorporates PRR7 and PRR9

Affiliations

A novel computational model of the circadian clock in Arabidopsis that incorporates PRR7 and PRR9

Melanie N Zeilinger et al. Mol Syst Biol. 2006.

Abstract

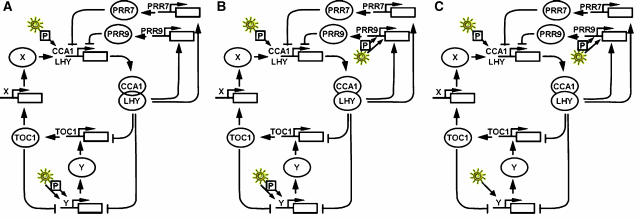
In plants, as in animals, the core mechanism to retain rhythmic gene expression relies on the interaction of multiple feedback loops. In recent years, molecular genetic techniques have revealed a complex network of clock components in Arabidopsis. To gain insight into the dynamics of these interactions, new components need to be integrated into the mathematical model of the plant clock. Our approach accelerates the iterative process of model identification, to incorporate new components, and to systematically test different proposed structural hypotheses. Recent studies indicate that the pseudo-response regulators PRR7 and PRR9 play a key role in the core clock of Arabidopsis. We incorporate PRR7 and PRR9 into an existing model involving the transcription factors TIMING OF CAB (TOC1), LATE ELONGATED HYPOCOTYL (LHY) and CIRCADIAN CLOCK ASSOCIATED (CCA1). We propose candidate models based on experimental hypotheses and identify the computational models with the application of an optimization routine. Validation is accomplished through systematic analysis of various mutant phenotypes. We introduce and apply sensitivity analysis as a novel tool for analyzing and distinguishing the characteristics of proposed architectures, which also allows for further validation of the hypothesized structures.


Figures

Figure 1
Figure 1
Schematic representation of the studied model structures. X, Y and P are hypothetical proteins. P mediates an acute light induction after a dark to light transition (A) PRR7-PRR9-Y network. PRR7 and PRR9 have been added to the interlocked feedback loop network in two negative feedback loops. LHY protein activates their transcription and in turn PRR7 and PRR9 protein represses the transcription of LHY in the negative arm of the loop. (B) PRR7-PRR9Light-Y network. We included light input on PRR9 transcription. (C) PRR7-PRR9Light-Y′ network. We removed the acute light activation term on Y. Light enters the system by two mechanisms, continuously and as a light pulse, denoted by P.
Figure 2
Figure 2
Comparison between experimental expression patterns for PRR7 and PRR9 and the simulated PRR9 expression from the PRR7-PRR9Light-Y network when released from entrained light–dark cycles to free-running light conditions (A) and for PRR9 under continuous white light (B). The cycling of PRR9/PRR7 was analyzed by real-time PCR after reverse transcription as described in the Experimental procedures section. Values are expressed relative to IPP2 loading control. TOC1 RNA levels are from Hazen et al (2005).
Figure 3
Figure 3
Phenotype comparison of the PRR7-PRR9Light-Y network. The continuous line represents CCR2∷LUC bioluminescence rhythms in prr7prr9toc1RNAi lines under continuous white light (70 μmol m−2 s−1). This experiment has been repeated three times with similar results. Seedlings were entrained in white light/dark cycles (12:12 h, 70 μmol m−2 s−1) for 5–7 days before being transferred to continuous light at ZT 0. For bioluminescence assays single seedlings were imaged every 2.5 h for 5 days and data were normalized to the mean luminescence value over the length of the time course. The dashed line represents TOC1 RNA oscillations in the PRR7-PRR9Light-Y network modeled in constant light.
Figure 4
Figure 4
Patterns for Y RNA expression in the interlocked model (A) and the PRR7-PRR9Light-Y model (B) under light–dark cycles. Whereas Y shows a transient increase in the morning and a later circadian peak in the evening in the interlocked model, it is clearly morning expressed in the new model.
Figure 5
Figure 5
Transcription rate of TOC1 under light–dark cycles results in the same activation pattern for the interlocked model (continuous line) and the PRR7-PRR9Light-Y (dashed line). The transcription rate is given by the effect of LHY repression and Y activation of TOC1. The acute activation by Y in the morning cancels the strong repression by LHY in both models and is determining for TOC1 patterns.
Figure 6
Figure 6
Y transcriptional activation under light/dark cycles in the PRR7-PRR9Light-Y model depends on the peak of TOC1 RNA expression. (A) PRR7-PRR9Light-Y model with an optimized parameter set that achieved a TOC1 RNA peak at ZT 11.2. (B) PRR7-PRR9Light-Y model with an optimized parameter set that achieved a TOC1 RNA peak at ZT 13.8. The continuous line represents the transcriptional activation term of Y transcription. The dashed line represents the repression of Y transcription by LHY. The broken line represents the repression of Y transcription by TOC1. Transcription rate of Y is comprised of repression by TOC1 and by LHY and activation by light.
Figure 7
Figure 7
Simulated TOC1 (A) and Y′ RNA (B) levels under light–dark cycles in the PRR7-PRR9LightY′ model. The continuous line represents RNA under short days (8 h light/16 h dark), and the dashed line under long days (16 h light/8 h dark). TOC1 and Y′ phase angles shift dependent on day length and announce dusk as observed in experimental data.
Figure 8
Figure 8
Sensitivity rankings of the Monte-Carlo multi-dimensional analysis for the PRR7-PRR9-Y model (A), the PRR7-PRR9Light-Y model (B) and the PRR7-PRR9Light-Y′ model (C). Sensitivity rankings range from 0 (very sensitive) to 1 (not sensitive). Parameters associated with the different components were added together in a gene-specific manner. m represents parameters associated with the RNA; c parameters are associated with the cytosolic protein levels, and n parameters are associated with the nuclear protein levels. Error bars denote standard deviations of the grouped rankings in the applied Monte-Carlo search of 10 000 parameter sets.
Figure 9
Figure 9
Parametric IPRC (A) and state IPRC (B) for the PRR7-PRR9light-Y′ model. The most sensitive parameters (apart from ld) are associated with repression of Y by TOC1 (g5), Y RNA degradation rate (m12), TOC1 protein transport (r4), TOC1 dark-dependent degradation (m7) and Y translation (p4). Each curve in (A) represents the phase response to the perturbations in the parameter specified in the legend. Each curve in (B) represents the phase response to the specified state. Tm, TOC1 RNA; Tc, TOC1 cytosolic protein; Tn, TOC1 nuclear protein; Ym, Y RNA; Yc, Y cytosolic protein; Yn, Y nuclear protein. Subjective day ranges between 0 and 12 h, and subjective night between 12 and 24 h. Phase shifts are given in hours.

Comment in

References

    1. Alabadi D, Oyama T, Yanovsky MJ, Harmon FG, Mas P, Kay SA (2001) Reciprocal regulation between TOC1 and LHY/CCA1 within the Arabidopsis circadian clock. Science 293: 880–883 - PubMed
    1. Alabadi D, Yanovsky MJ, Mas P, Harmer SL, Kay SA (2002) Critical role for CCA1 and LHY in maintaining circadian rhythmicity in Arabidopsis. Curr Biol 12: 757–761 - PubMed
    1. Covington MF, Panda S, Liu XL, Strayer CA, Wagner DR, Kay SA (2001) ELF3 modulates resetting of the circadian clock in Arabidopsis. Plant Cell 13: 1305–1315 - PMC - PubMed
    1. Csete ME, Doyle JC (2002) Reverse engineering of biological complexity. Science 295: 1664–1669 - PubMed
    1. Devlin PF, Kay SA (2000) Cryptochromes are required for phytochrome signaling to the circadian clock but not for rhythmicity. Plant Cell 12: 2499–2510 - PMC - PubMed

Publication types