Review
. 2006:2:62.
doi: 10.1038/msb4100109. Epub 2006 Nov 14.

Metabolic networks in motion: 13C-based flux analysis

Affiliations
Review

Metabolic networks in motion: 13C-based flux analysis

Uwe Sauer. Mol Syst Biol. 2006.

Abstract

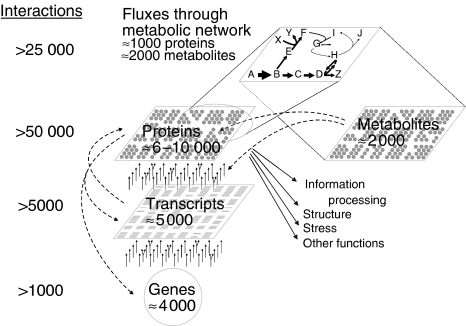
Many properties of complex networks cannot be understood from monitoring the components--not even when comprehensively monitoring all protein or metabolite concentrations--unless such information is connected and integrated through mathematical models. The reason is that static component concentrations, albeit extremely informative, do not contain functional information per se. The functional behavior of a network emerges only through the nonlinear gene, protein, and metabolite interactions across multiple metabolic and regulatory layers. I argue here that intracellular reaction rates are the functional end points of these interactions in metabolic networks, hence are highly relevant for systems biology. Methods for experimental determination of metabolic fluxes differ fundamentally from component concentration measurements; that is, intracellular reaction rates cannot be detected directly, but must be estimated through computer model-based interpretation of stable isotope patterns in products of metabolism.


Figures

Figure 1
Figure 1
Schematic overview of the relationship between concentration-based, compositional, and functional units in metabolic networks. Regulatory interactions are indicated by dashed lines. Transcript–transcript interactions are based on average operon structures and ribosomal RNA interactions. Proteome interaction estimates include an average of 6–7 protein–protein interactions (Szallasi, 2006) as well as protein–DNA, protein–RNA, and protein–membrane interactions. Metabolic interactions include biochemical transformations and regulatory interactions between metabolites, RNA, and protein. The number of different proteins includes differences in folding, size, and covalent modifications.
Figure 2
Figure 2
(A) Schematic flow chart of 13C-based metabolic flux analysis. Exemplary results for flux ratios and absolute fluxes are given in the bottom boxes. (B) Example of inferring relative fluxes through the three initial pathways of glucose catabolism in E. coli from mass spectrometry data. A positional label is introduced by feeding [1-13C]glucose, and 13C-pattern are detected in alanine, which derives its carbon backbone directly from pyruvate. Although unique isotope pattern occurs in intact alanine molecules, the lack of positional information in the detected mass distribution cannot discriminate between glycolysis and the ED pathway. For discrimination of these two pathways, additionally the C2–C3 moiety of alanine must be analyzed, which occurs by fragmentation in some MS instruments. For flux ratios, the relative contribution of these pathways to the formation of alanine (pyruvate) is calculated directly from the detected abundance of the different mass isotope isomers by probabilistic equations. For absolute fluxes, a best-fit flux solution is obtained by extensive computations that seek to minimize the error between fitted intracellular fluxes not only to the six shown, but also to all other detected mass spectra and physiological uptake and production rates.
Figure 3
Figure 3
(A) Bow-tie abstraction of metabolic network organization (after (Csete and Doyle, 2004; Stelling et al, 2006). (B) Metabolic fluxes through three major pathways in the central metabolism of 137 B. subtilis knockout mutants. The phosphoglucose isomerase (Pgi) mutant and three mutants in genes encoding for enzymes of the TCA cycle are expected outliers because one of the plotted pathways was blocked. All other mutants cluster in a distinct region of this 3D flux space with the sole exception of the novel transcriptional regulator CcpN (Servant et al, 2005). Data are taken from Fischer and Sauer (2005).

Similar articles

Cited by

References

    1. Aderem A (2005) Systems biology: its practice and challenges. Cell 121: 511–513 - PubMed
    1. Almaas E, Kovacs B, Vicsek T, Oltavi ZN, Barabasi AL (2004) Global organization of metabolic fluxes in the bacterium Escherichia coli. Nature 427: 839–843 - PubMed
    1. Antoniewicz MR, Kelleher JK, Stephanopoulos G (2006) Determination of confidence intervals of metabolic fluxes estimated from stable isotope measurements. Metab Eng 8: 324–337 - PubMed
    1. Arauzo-Bravo MJ, Shimizu K (2003) An improved method for statistical analysis of metabolic flux analysis using isotopomer mapping matrices with analytical expression. J Biotechnol 105: 117–133 - PubMed
    1. Bacher A, Rieder C, Eichinger D, Arigoni D, Fuchs G, Eisenreich W (1999) Elucidation of novel biosynthetic pathways and metabolic flux patterns by retrobiosynthetic NMR analysis. FEMS Microbiol Rev 22: 567–598