

Concerted conformational effects of Ca2+ and ATP are required for activation of sequential reactions in the Ca2+ ATPase (SERCA) catalytic cycle
- PMID: 17105196
- PMCID: PMC2525454
- DOI: 10.1021/bi061255d
Concerted conformational effects of Ca2+ and ATP are required for activation of sequential reactions in the Ca2+ ATPase (SERCA) catalytic cycle
Abstract
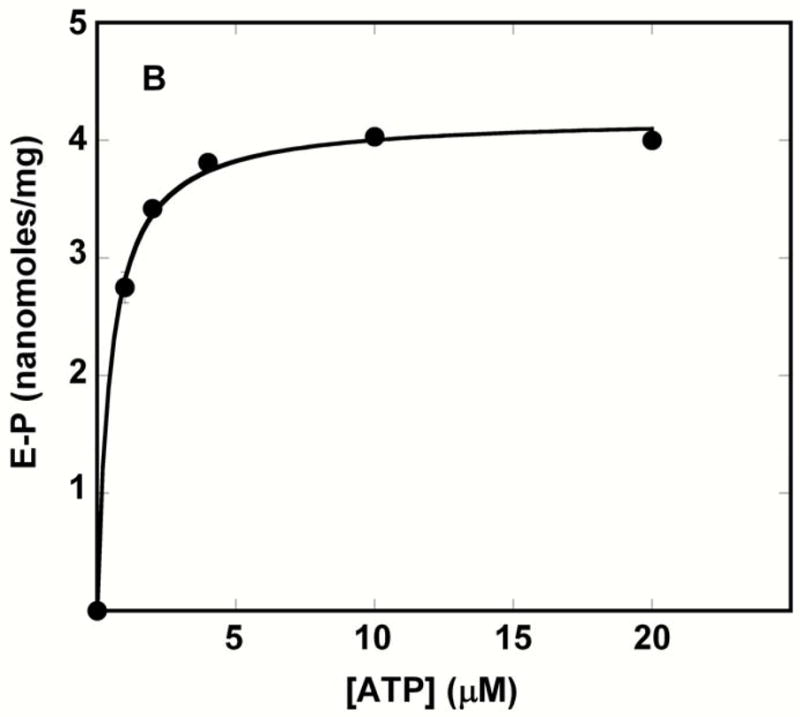
We relate solution behavior to the crystal structure of the Ca2+ ATPase (SERCA). We find that nucleotide binding occurs with high affinity through interaction of the adenosine moiety with the N domain, even in the absence of Ca2+ and Mg2+, or to the closed conformation stabilized by thapsigargin (TG). Why then is Ca2+ crucial for ATP utilization? The influence of adenosine 5'-(beta,gamma-methylene) triphosphate (AMPPCP), Ca2+, and Mg2+ on proteolytic digestion patterns, interpreted in the light of known crystal structures, indicates that a Ca2+-dependent conformation of the ATPase headpiece is required for a further transition induced by nucleotide binding. This includes opening of the headpiece, which in turn allows inclination of the "A" domain and bending of the "P" domain. Thereby, the phosphate chain of bound ATP acquires an extended configuration allowing the gamma-phosphate to reach Asp351 to form a complex including Mg2+. We demonstrate by Asp351 mutation that this "productive" conformation of the substrate-enzyme complex is unstable because of electrostatic repulsion at the phosphorylation site. However, this conformation is subsequently stabilized by covalent engagement of the -phosphate yielding the phosphoenzyme intermediate. We also demonstrate that the ADP product remains bound with high affinity to the transition state complex but dissociates with lower affinity as the phosphoenzyme undergoes a further conformational change (i.e., E1-P to E2-P transition). Finally, we measured low-affinity ATP binding to stable phosphoenzyme analogues, demonstrating that the E1-P to E2-P transition and the enzyme turnover are accelerated by ATP binding to the phosphoenzyme in exchange for ADP.
Figures


Similar articles
-
Substrate-induced conformational fit and headpiece closure in the Ca2+ATPase (SERCA).J Biol Chem. 2003 Aug 1;278(31):28938-43. doi: 10.1074/jbc.M304120200. Epub 2003 May 15. J Biol Chem. 2003. PMID: 12750373
-
Reactions of the sarcoplasmic reticulum calcium adenosinetriphosphatase with adenosine 5'-triphosphate and Ca2+ that are not satisfactorily described by an E1-E2 model.Biochemistry. 1987 Dec 1;26(24):7654-67. doi: 10.1021/bi00398a019. Biochemistry. 1987. PMID: 2962640
-
Conformational fluctuations of the Ca2+-ATPase in the native membrane environment. Effects of pH, temperature, catalytic substrates, and thapsigargin.J Biol Chem. 2008 Jan 11;283(2):1189-96. doi: 10.1074/jbc.M707189200. Epub 2007 Nov 9. J Biol Chem. 2008. PMID: 17993458
-
Functional consequences of alterations to Thr247, Pro248, Glu340, Asp813, Arg819, and Arg822 at the interfaces between domain P, M3, and L6-7 of sarcoplasmic reticulum Ca2+-ATPase. Roles in Ca2+ interaction and phosphoenzyme processing.J Biol Chem. 2004 Dec 24;279(52):54426-37. doi: 10.1074/jbc.M410204200. Epub 2004 Oct 12. J Biol Chem. 2004. PMID: 15485864
-
Phosphoenzyme conformational states and nucleotide-binding site hydrophobicity following thiol modification of the Ca2+-ATPase of sarcoplasmic reticulum from skeletal muscle.J Biol Chem. 1987 May 25;262(15):7041-6. J Biol Chem. 1987. PMID: 2953714
Cited by
-
What ATP binding does to the Ca2+ pump and how nonproductive phosphoryl transfer is prevented in the absence of Ca2.Proc Natl Acad Sci U S A. 2020 Aug 4;117(31):18448-18458. doi: 10.1073/pnas.2006027117. Epub 2020 Jul 16. Proc Natl Acad Sci U S A. 2020. PMID: 32675243 Free PMC article.
-
Atomic-level characterization of the activation mechanism of SERCA by calcium.PLoS One. 2011;6(10):e26936. doi: 10.1371/journal.pone.0026936. Epub 2011 Oct 27. PLoS One. 2011. PMID: 22046418 Free PMC article.
-
Structural and dynamic basis of phospholamban and sarcolipin inhibition of Ca(2+)-ATPase.Biochemistry. 2008 Jan 8;47(1):3-13. doi: 10.1021/bi701668v. Epub 2007 Dec 15. Biochemistry. 2008. PMID: 18081313 Free PMC article. Review.
-
Concerted but noncooperative activation of nucleotide and actuator domains of the Ca-ATPase upon calcium binding.Biochemistry. 2008 Nov 25;47(47):12448-56. doi: 10.1021/bi8014289. Biochemistry. 2008. PMID: 18956892 Free PMC article.
-
Disturbed cardiac mitochondrial and cytosolic calcium handling in a metabolic risk-related rat model of heart failure with preserved ejection fraction.Acta Physiol (Oxf). 2020 Mar;228(3):e13378. doi: 10.1111/apha.13378. Epub 2019 Oct 10. Acta Physiol (Oxf). 2020. PMID: 31520455 Free PMC article.
References
-
- MacLennan DH, Brandl CJ, Korczak B, Green NM. Amino-acid sequence of a Ca2+ + Mg2+-dependent ATPase from rabbit muscle sarcoplasmic reticulum, deduced from its complementary DNA sequence. Nature. 1985;31:6, 696–700. - PubMed
-
- Zhang P, Toyoshima C, Yonekura K, Green NM, Stokes DL. Structure of the calcium pump from sarcoplasmic reticulum at 8-A resolution. Nature. 1998;392:835–9. - PubMed
-
- de Meis L, Vianna AL. Energy interconversion by the Ca2+-dependent ATPase of the sarcoplasmic reticulum. Annu Rev Biochem. 1979;48:275–92. - PubMed
-
- Moller JV, Juul B, le Maire M. Structural organization, ion transport, and energy transduction of P-type ATPases. Biochim Biophys Acta. 1996;128:6, 1–51. - PubMed
-
- Andersen JP, Vilsen B. Structure-function relationships of the calcium binding sites of the sarcoplasmic reticulum Ca(2+)-ATPase. Acta Physiol Scand Suppl. 1998;64:3, 45–54. - PubMed
Publication types
MeSH terms
Substances
Grants and funding
LinkOut - more resources
Full Text Sources
Other Literature Sources
Miscellaneous
