

A comparison of the emission efficiency of four common green fluorescence dyes after internalization into cancer cells
- PMID: 17105220
- PMCID: PMC2556176
- DOI: 10.1021/bc0601626
A comparison of the emission efficiency of four common green fluorescence dyes after internalization into cancer cells
Abstract
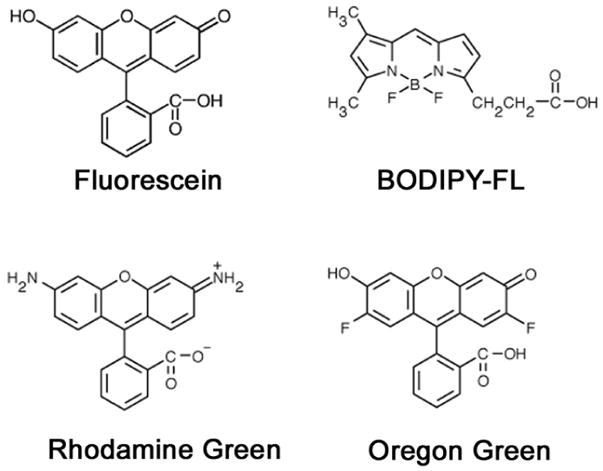
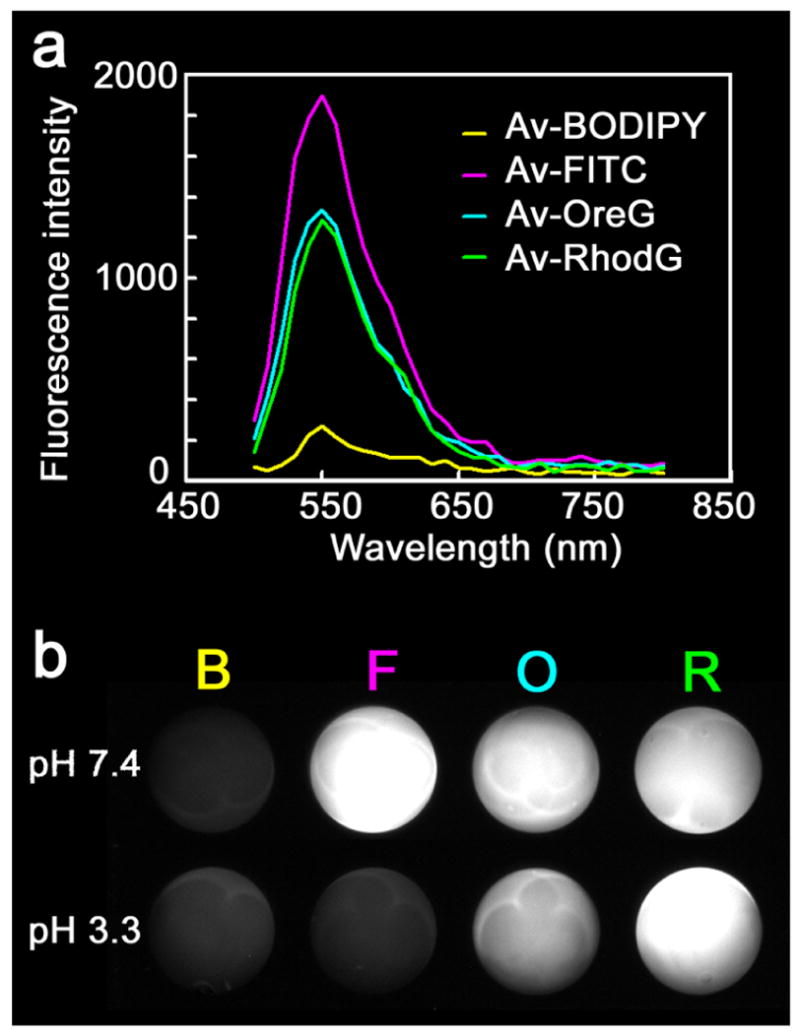
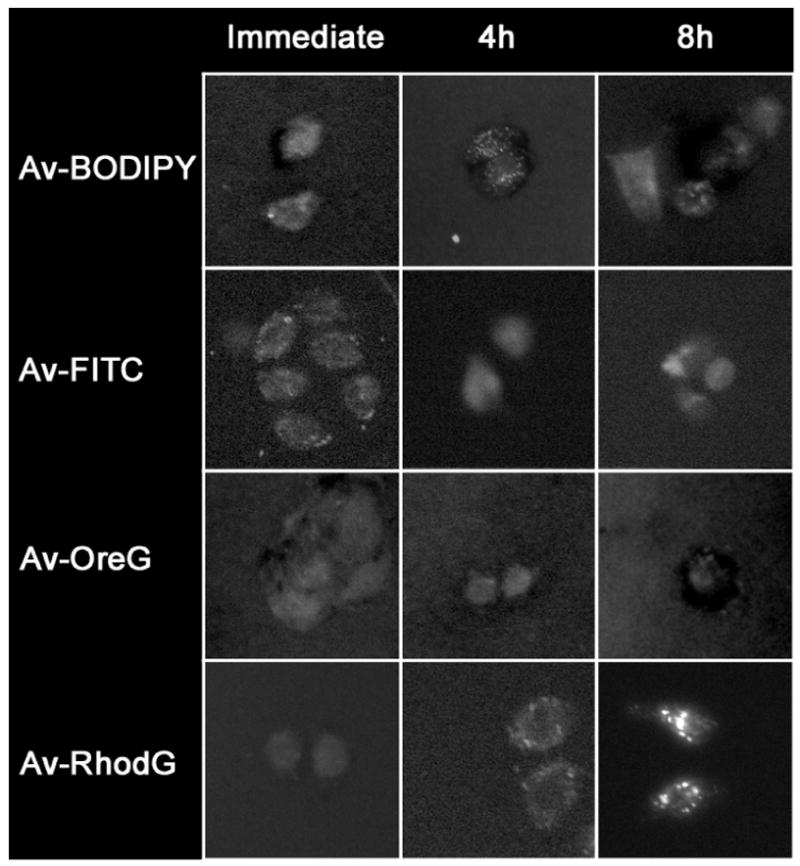
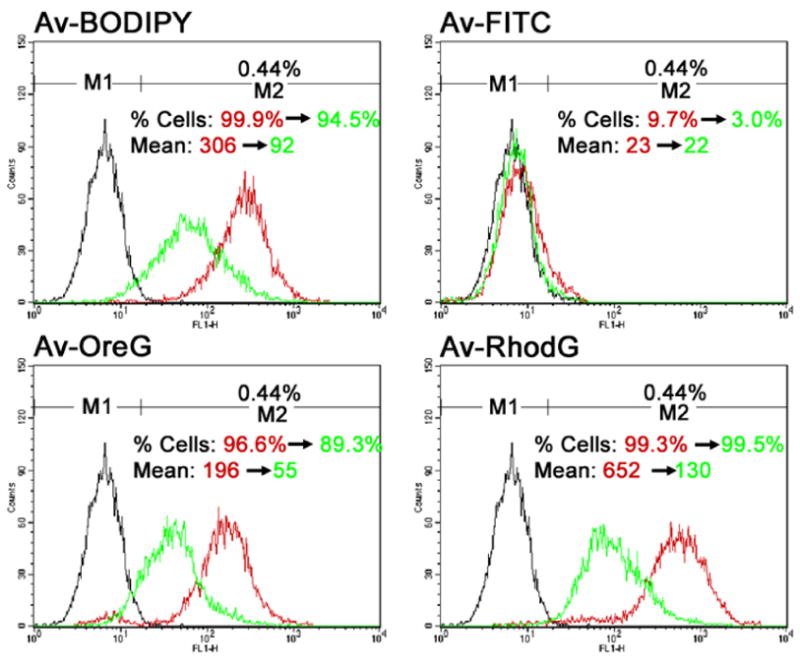
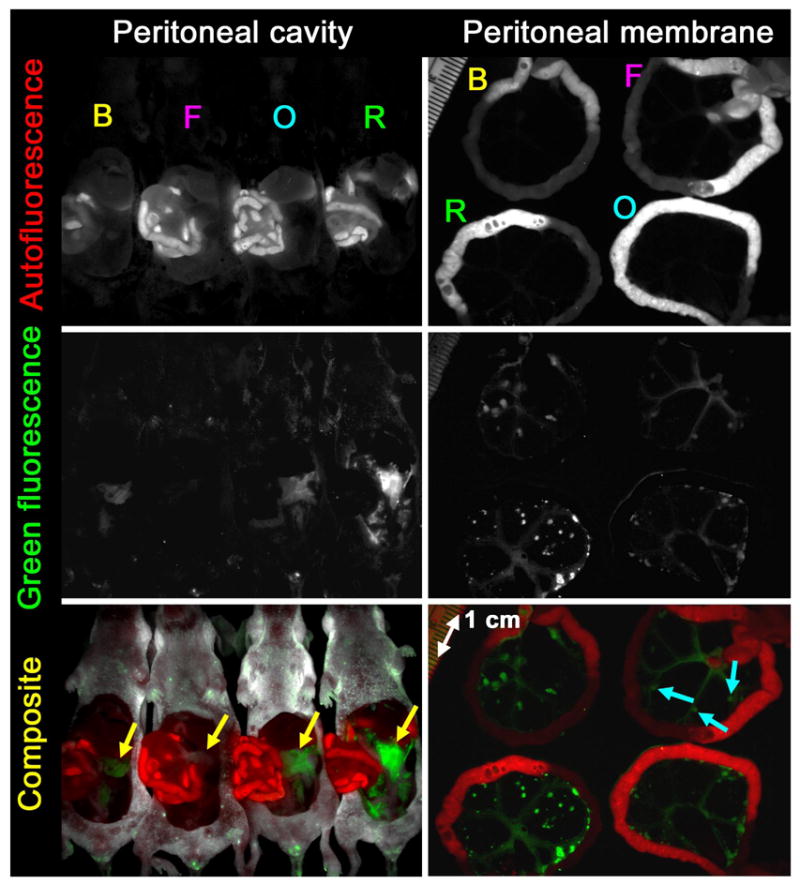
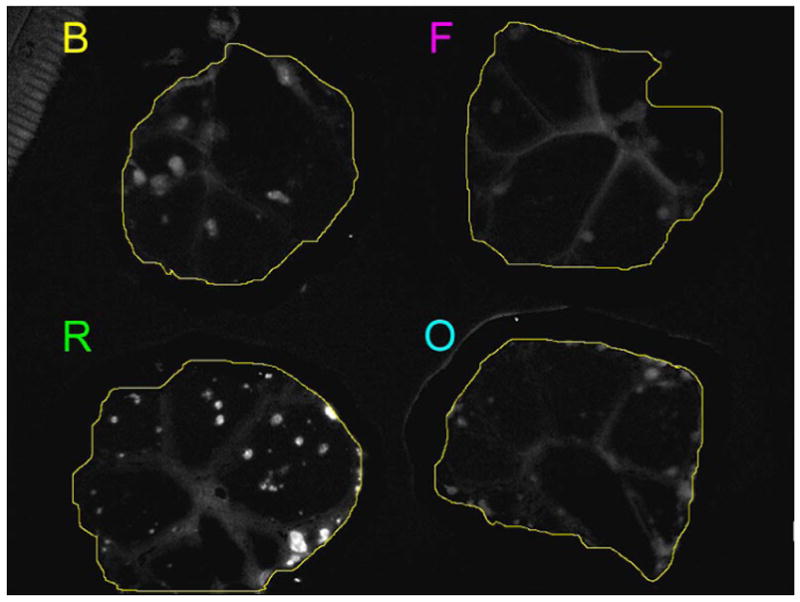
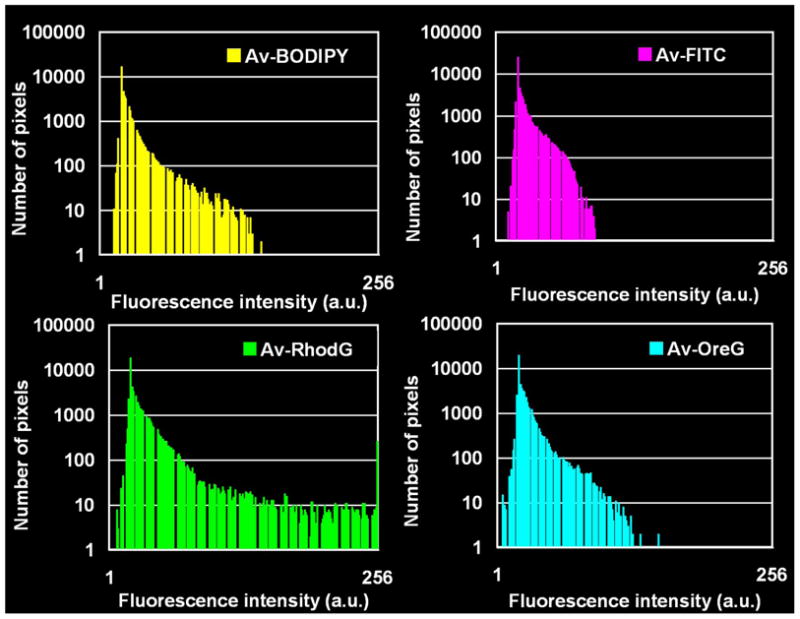
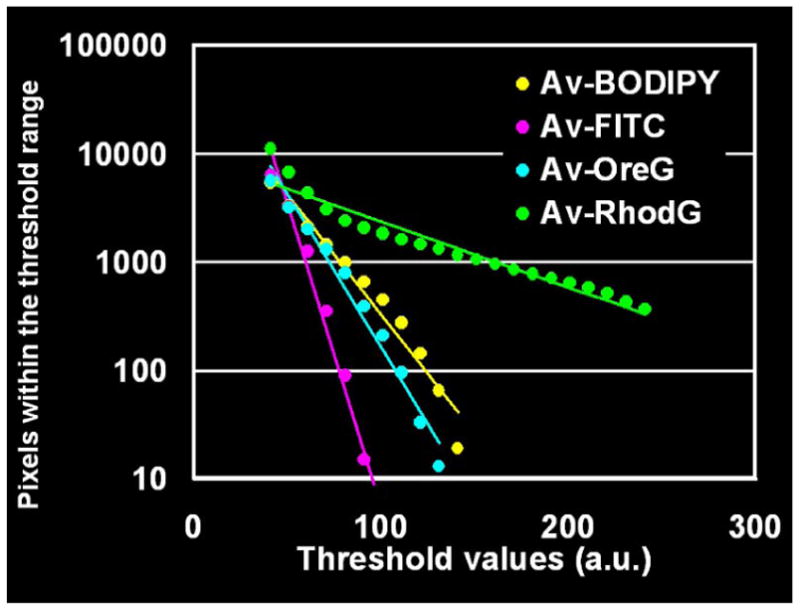
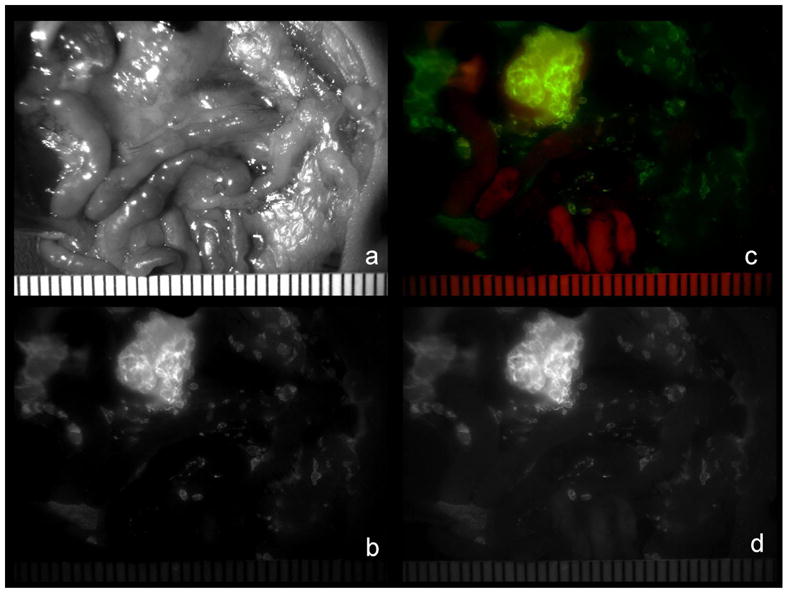
In vivo optical imaging to enhance the detection of cancer during endoscopy or surgery requires a targeted fluorescent probe with high emission efficiency and high signal-to-background ratio. One strategy to accurately detect cancers is to have the fluorophore internalize within the cancer cells permitting nonbound fluorophores to be washed away or absorbed. The choice of fluorophores for this task must be carefully considered. For depth of penetration, near-infrared probes are ordinarily preferred but suffer from relatively low quantum efficiency. Although green fluorescent protein has been widely used to image tumors on internal organs in mice, green fluorescent probes are better suited for imaging the superficial tissues because of the short penetration distance of green light in tissue and the highly efficient production of signal. While the fluorescence properties of green fluorophores are well-known in vitro, less attention has been paid to their fluorescence once they are internalized within cells. In this study, the emission efficiency after cellular internalization of four common green fluorophores conjugated to avidin (Av-fluorescein, Av-Oregon green, Av-BODIPY-FL, and Av-rhodamine green) were compared after each conjugate was incubated with SHIN3 ovarian cancer cells. Using the lectin binding receptor system, the avidin-fluorophore conjugates were endocytosed, and their fluorescence was evaluated with fluorescence microscopy and flow cytometry. While fluorescein demonstrated the highest signal outside the cell, among the four fluorophores, internalized Av-rhodamine green emitted the most light from SHIN3 ovarian cancer cells both in vitro and in vivo. The internalized Av-rhodamine green complex appeared to localize to the endoplasmic vesicles. Thus, among the four common green fluorescent dyes, rhodamine green is the brightest green fluorescence probe after cellular internalization. This information could have implications for the design of tumor-targeted fluorescent probes that rely on cellular internalization for cancer detection.
Figures
Similar articles
-
Fluorophore-quencher based activatable targeted optical probes for detecting in vivo cancer metastases.Mol Pharm. 2009 Mar-Apr;6(2):386-95. doi: 10.1021/mp800115t. Mol Pharm. 2009. PMID: 19718793 Free PMC article.
-
A self-quenched galactosamine-serum albumin-rhodamineX conjugate: a "smart" fluorescent molecular imaging probe synthesized with clinically applicable material for detecting peritoneal ovarian cancer metastases.Clin Cancer Res. 2007 Nov 1;13(21):6335-43. doi: 10.1158/1078-0432.CCR-07-1004. Clin Cancer Res. 2007. PMID: 17975145
-
Avidin conjugated to tetramethyl-6-carboxyrhodamine-QSY®7.2009 Feb 20 [updated 2009 Apr 6]. In: Molecular Imaging and Contrast Agent Database (MICAD) [Internet]. Bethesda (MD): National Center for Biotechnology Information (US); 2004–2013. 2009 Feb 20 [updated 2009 Apr 6]. In: Molecular Imaging and Contrast Agent Database (MICAD) [Internet]. Bethesda (MD): National Center for Biotechnology Information (US); 2004–2013. PMID: 20641900 Free Books & Documents. Review.
-
High sensitivity detection of cancer in vivo using a dual-controlled activation fluorescent imaging probe based on H-dimer formation and pH activation.Mol Biosyst. 2010 May;6(5):888-93. doi: 10.1039/b917876g. Epub 2010 Feb 9. Mol Biosyst. 2010. PMID: 20567775 Free PMC article.
-
Activatable Alexa Fluor680-conjugated panitumumab and indocyanine green-conjugated trastuzumab cocktail.2012 May 16 [updated 2012 Jul 10]. In: Molecular Imaging and Contrast Agent Database (MICAD) [Internet]. Bethesda (MD): National Center for Biotechnology Information (US); 2004–2013. 2012 May 16 [updated 2012 Jul 10]. In: Molecular Imaging and Contrast Agent Database (MICAD) [Internet]. Bethesda (MD): National Center for Biotechnology Information (US); 2004–2013. PMID: 22787692 Free Books & Documents. Review.
Cited by
-
Structurally Characterized BODIPY-Appended Oxidovanadium(IV) β-Diketonates for Mitochondria-Targeted Photocytotoxicity.ACS Omega. 2020 Feb 24;5(8):4282-4292. doi: 10.1021/acsomega.9b04204. eCollection 2020 Mar 3. ACS Omega. 2020. PMID: 32149258 Free PMC article.
-
Two-step synthesis of galactosylated human serum albumin as a targeted optical imaging agent for peritoneal carcinomatosis.J Med Chem. 2010 Feb 25;53(4):1579-86. doi: 10.1021/jm901228u. J Med Chem. 2010. PMID: 20102220 Free PMC article.
-
Combining nitric oxide and calcium sensing for the detection of endothelial dysfunction.Commun Chem. 2023 Aug 29;6(1):179. doi: 10.1038/s42004-023-00973-8. Commun Chem. 2023. PMID: 37644120 Free PMC article. Review.
-
Determination of optimal rhodamine fluorophore for in vivo optical imaging.Bioconjug Chem. 2008 Aug;19(8):1735-42. doi: 10.1021/bc800140c. Epub 2008 Jul 9. Bioconjug Chem. 2008. PMID: 18610943 Free PMC article.
-
Synthesis and Characterization of a Novel Green Cationic Polyfluorene and Its Potential Use as a Fluorescent Membrane Probe.Polymers (Basel). 2018 Aug 23;10(9):938. doi: 10.3390/polym10090938. Polymers (Basel). 2018. PMID: 30960863 Free PMC article.
References
-
- Hoffman RM. The multiple uses of fluorescent proteins to visualize cancer in vivo. Nat Rev Cancer. 2005;5:796–806. - PubMed
-
- Bremer C, Ntziachristos V, Weissleder R. Optical-based molecular imaging: contrast agents and potential medical applications. Eur Radiol. 2003;13:231–243. - PubMed
-
- Ntziachristos V, Bremer C, Weissleder R. Fluorescence imaging with near-infrared light: new technological advances that enable in vivo molecular imaging. Eur Radiol. 2003;13:195–208. - PubMed
-
- Ciardella AP, Prall FR, Borodoker N, Cunningham ET., Jr Imaging techniques for posterior uveitis. Curr Opin Ophthalmol. 2004;15:519–30. - PubMed
Publication types
MeSH terms
Substances
Grants and funding
LinkOut - more resources
Full Text Sources
Other Literature Sources
