. 2006 Nov;4(11):e362.
doi: 10.1371/journal.pbio.0040362.

The liganding of glycolipid transfer protein is controlled by glycolipid acyl structure

Affiliations

The liganding of glycolipid transfer protein is controlled by glycolipid acyl structure

Lucy Malinina et al. PLoS Biol. 2006 Nov.

Abstract

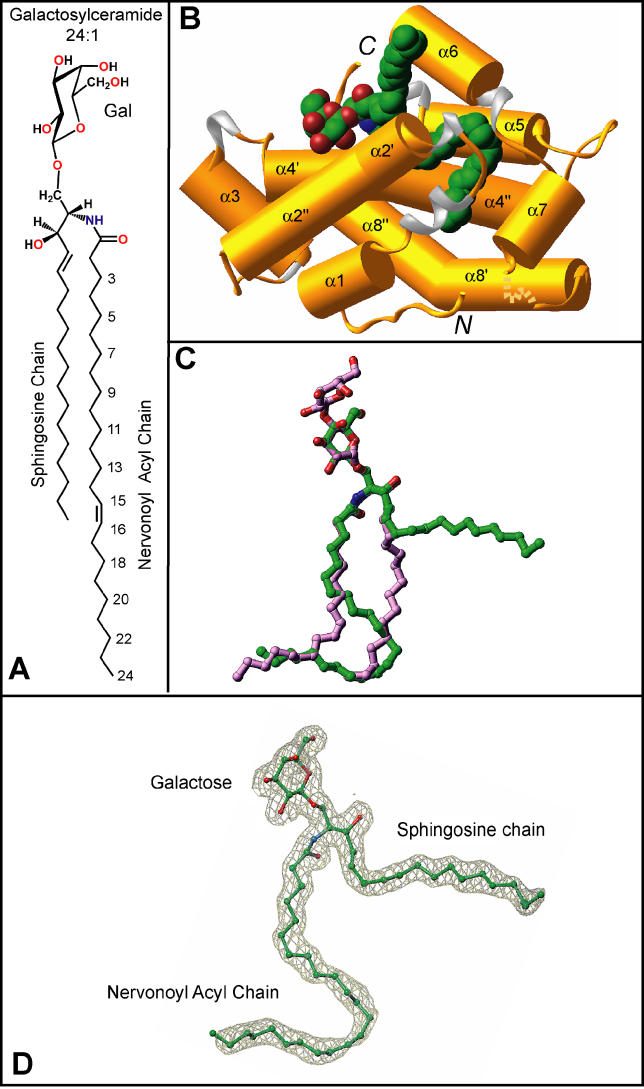
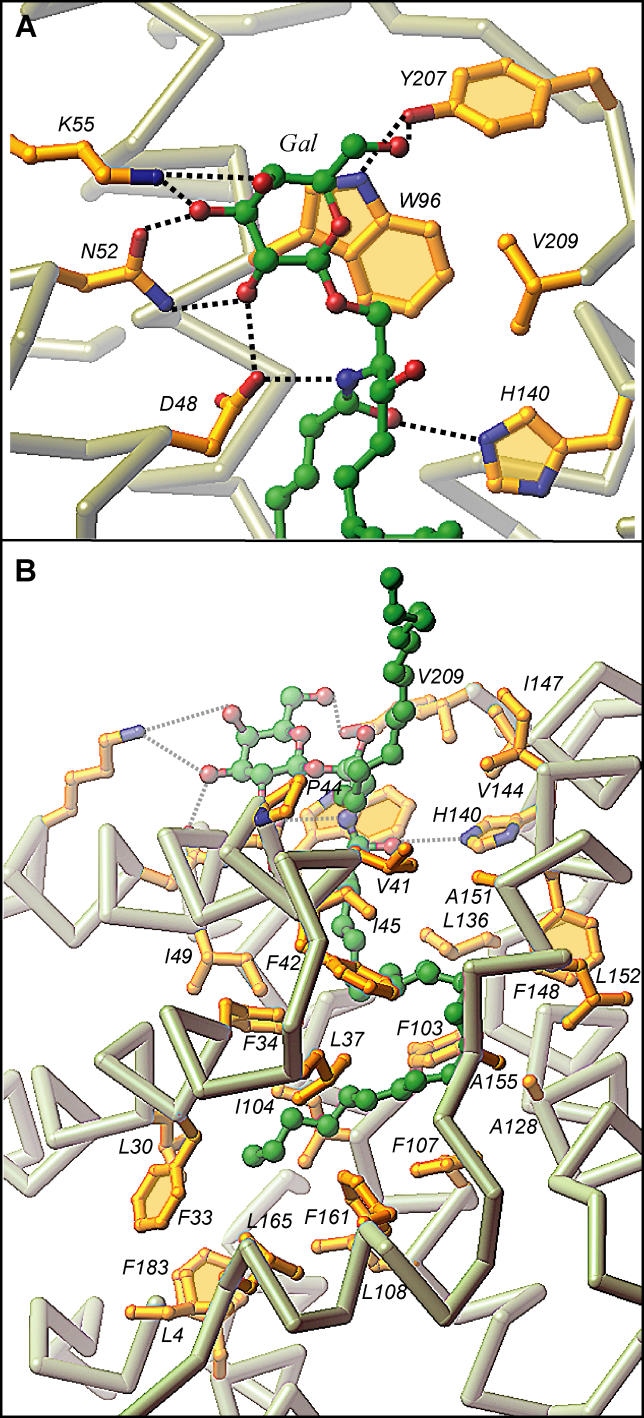
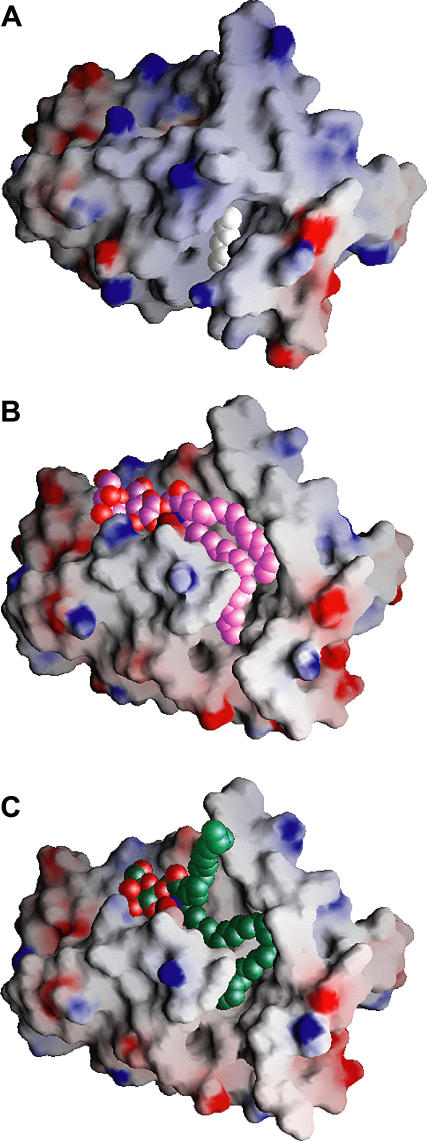
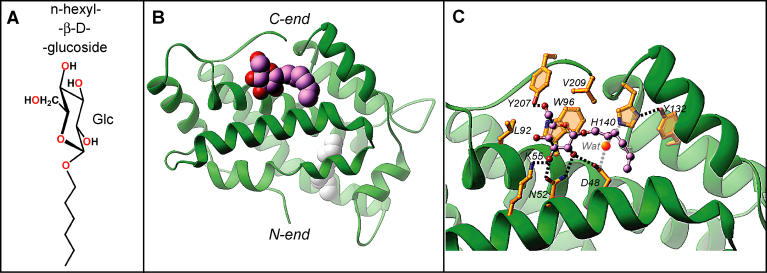
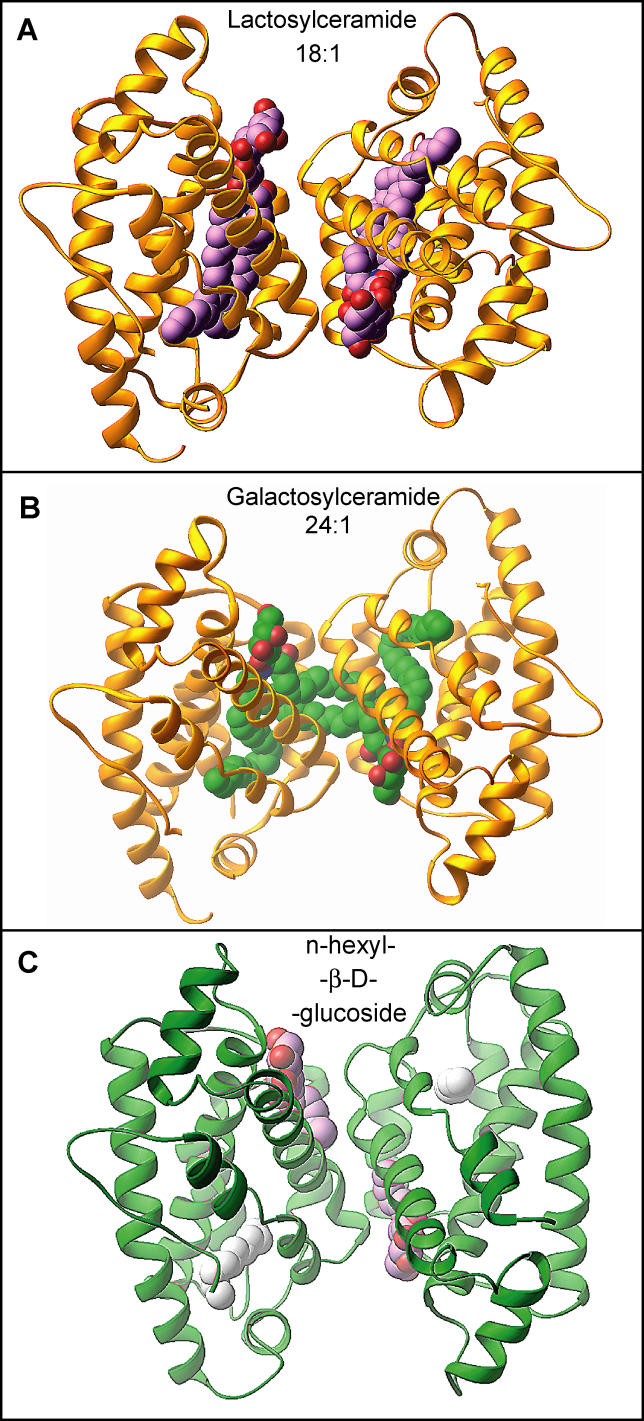
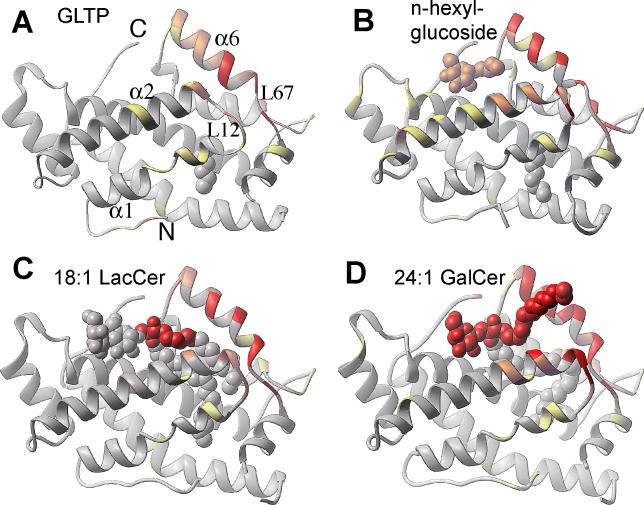
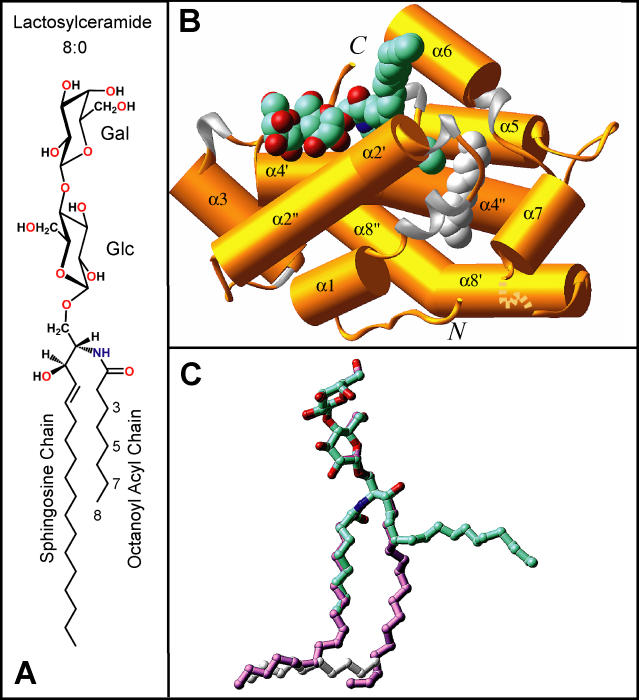
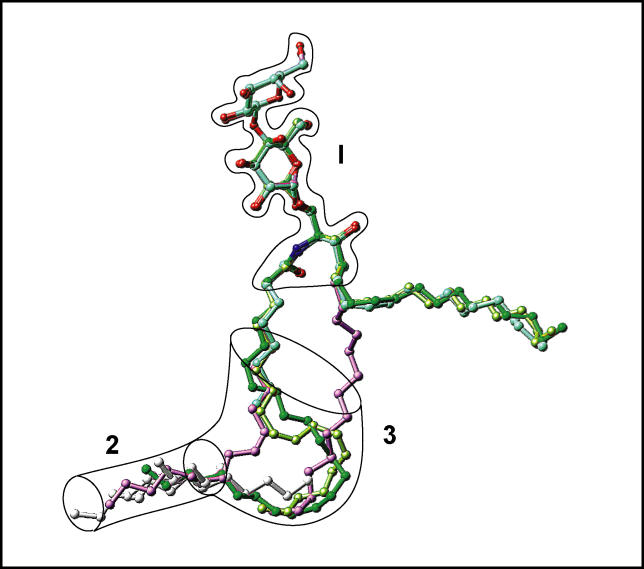
Glycosphingolipids (GSLs) play major roles in cellular growth and development. Mammalian glycolipid transfer proteins (GLTPs) are potential regulators of cell processes mediated by GSLs and display a unique architecture among lipid binding/transfer proteins. The GLTP fold represents a novel membrane targeting/interaction domain among peripheral proteins. Here we report crystal structures of human GLTP bound to GSLs of diverse acyl chain length, unsaturation, and sugar composition. Structural comparisons show a highly conserved anchoring of galactosyl- and lactosyl-amide headgroups by the GLTP recognition center. By contrast, acyl chain chemical structure and occupancy of the hydrophobic tunnel dictate partitioning between sphingosine-in and newly-observed sphingosine-out ligand-binding modes. The structural insights, combined with computed interaction propensity distributions, suggest a concerted sequence of events mediated by GLTP conformational changes during GSL transfer to and/or from membranes, as well as during GSL presentation and/or transfer to other proteins.


Conflict of interest statement

Competing interests. The authors have declared that no competing interests exist.

Figures

Figure 1
Figure 1. Structure of the 24:1 GalCer-GLTP Complex
(A) Chemical formula of 24:1 galactosylceramide. (B) Crystal structure of the 24:1 GalCer-GLTP complex. α helices (colored gold) are shown in a cylinder representation, 310 helices (colored silver) and loop regions (colored gold) are in ribbon representations, and bound GalCer is in a space-filling representation. The glycolipid atoms are colored green, red, and blue for carbon, oxygen, and nitrogen atoms, respectively. (C) Superposition of stick representations of 24:1 GalCer (carbon atoms colored in green) and 18:1 LacCer (carbon atoms colored in lavender) derived from their sphingosine-out and sphingosine-in GLTP complexes, respectively. (D) The 24:1 GalCer ligand structure inside the simulated annealed omit 2F o-F c map contoured at 1σ level. The color code for the glycolipid atoms is the same as in (B).
Figure 2
Figure 2. GSL-GLTP Interactions in the 24:1 GalCer-GLTP Complex
(A) 24:1 GalCer headgroup (sugar and amide) interactions with GLTP recognition center residues. Hydrogen bonds are shown by dashed lines. The bound GSL atoms are colored by green, red, and blue for carbon, oxygen, and nitrogen atoms, respectively. The GLTP Cα backbone is colored light gray, the side chains are shown in gold, and oxygen and nitrogen are red and blue, respectively. (B) 24:1 GalCer lipid interactions with the GLTP channel residues. The longer acyl chain is directed into the channel while the shorter sphingosine chain is directed outwards.
Figure 3
Figure 3. Gate-Removed Electrostatic Surface Views of the GLTP Hydrophobic Tunnel Accommodating GSLs and/or Extraneous Hydrocarbons
(A) Structure of apo-GLTP. The GLTP is shown in an electrostatic surface representation (blue, positive; red, negative; gray, neutral), with gate residues 33 and 35 to 39 removed to make the tunnel visible in (A), and residues 33 and 35 to 45 removed in (B) and (C). The view for apo-GLTP shows the collapsed upper part of the tunnel and bound extraneous hydrocarbon positioned within the uncollapsed bottom of the tunnel. The carbon atoms of the extraneous hydrocarbon are shown in a white space-filling representation. (B) Structure of the 18:1 LacCer-GLTP complex exhibiting the sphingosine-in mode. The carbon atoms of the 18:1 LacCer are shown in a lavender space-filling representation. Both lipid chains optimally fit into the available space of the hydrophobic tunnel. (C) Structure of the 24:1 GalCer-GLTP complex exhibiting the sphingosine-out mode. The carbon atoms of the 24:1 GalCer are shown in a green space-filling representation. The long acyl chain, bent in a serpentine fashion, occupies the available space of the hydrophobic tunnel, resulting in an outward positioning of the sphingosine chain.
Figure 4
Figure 4. Stereo Superposition of the Conformational States of GLTP
(A) The GLTP backbone is shown in red, gold, or green Cα representation for apo-GLTP and GLTP complexes with n-hexyl-β-d-glucoside and 24:1 GalCer, respectively. (B) The GLTP Cα backbone is shown in green and lavender for GLTP complexes with 24:1 GalCer and 18:1 LacCer, respectively.
Figure 5
Figure 5. Structure of the n-hexyl-β-d-glucoside-GLTP Complex
(A) Chemical formula of n-hexyl-β-d-glucoside. (B) Crystal structure of the n-hexyl-β-d-glucoside-GLTP complex, with the n-hexyl-β-d-glucoside molecule accommodated within the sugar recognition center on the GLTP surface. The GLTP is shown in a green ribbon representation, and the carbon atoms of the n-hexyl-β-d-glucoside are shown in a lavender space-filling representation. Extraneous hydrocarbon is shown in a white space-filling representation. (C) The n-hexyl-β-d-glucoside interactions with GLTP recognition center residues. Hydrogen bonds are shown by dashed lines. The bound ligand atoms are colored by lavender, red, and blue for carbon, oxygen, and nitrogen atoms, respectively. The water molecule bridging H140 with D48 is shown by bright red sphere.
Figure 6
Figure 6. Analytical Ultracentrifugation Data on Apo-GLTP and its GSL Complexes.
Analytical ultracentrifugation data of apo-GLTP (A) and GLTP complexes with n-hexyl-β-d-glucoside (B), 18:1 LacCer (C), and 24:1 GalCer (D). The 30 μM protein samples were centrifuged at 20 °C and 19,000 rpm in 20 mM Tris-HCl (pH 8.0) and 150 mM NaCl. Note that nonrandom residuals were observed in all cases.
Figure 7
Figure 7. Crystal-Related Dimerization of GLTP Complexed with Different GSL Ligands
(A) Crystal-related dimer in the structure of the 18:1 LacCer-GLTP [16]. The GLTPs are shown in a gold ribbon representation, and the carbon atoms of the LacCers are shown in a lavender space-filling representation. (B) Crystal-related cross dimer in the structure of the 24:1 GalCer-GLTP complex. The GLTPs are shown in a gold ribbon representation, and the carbon atoms of the GalCers are shown in a green space-filling representation. (C) Crystal-related dimer in the structure of the n-hexyl-β-d-glucoside-GLTP complex. The GLTPs are shown in a green ribbon representation, while the carbon atoms of the n-hexyl-β-d-glucoside are shown in a lavender space-filling representation. Extraneous hydrocarbon is shown in a white space-filling representation.
Figure 8
Figure 8. Comparison of the GLTP-Bound GSL Structures
(A) Schematic of GSL interactions involving 24:1 GalCer in the sphingosine-out binding mode. Lettering indicates interacting GLTP amino acids, dashed arrows show hydrogen bonds oriented from donor to acceptor, the gray surface covers lipid atoms interacting with W96 indole group, the colored planes cover lipid regions participating in interchain interaction, gray lettering corresponds to interactions with a neighbor GLTP in the packing-related dimer in the crystal. The insert shows a schematic of sphingosine-sphingosine interaction of 24:1 GalCer in the crystal-related cross dimer. (B) Schematic of GSL interactions involving 18:1 LacCer in the sphingosine-in binding mode. Lettering and colored planes are defined as in (A).
Figure 9
Figure 9. Distribution of the Protein-Protein and Protein-Membrane Interaction Propensities over the GLTP Surface Calculated by the ODA Approach for Four Different GLTP Conformational States
(A) apo-GLTP with an extraneous hydrocarbon. (B) GLTP complex with n-hexyl-β-d-glucoside. (C) Sphingosine-in GLTP complex with 18:1 LacCer. (D) Sphingosine-out GLTP complex with 24:1 GalCer. Structures are colored by the absolute magnitude of the ODA signal from the strongest in red, through medium in orange and weak in yellow, to the weakest in gray.
Figure 10
Figure 10. Structure of the 8:0 LacCer-GLTP Complex
(A) Chemical formula of 8:0 lactosylceramide. (B) Crystal structure of the 8:0 LacCer-GLTP complex. The GLTP is shown in a gold ribbon representation, and the carbon atoms of the LacCer are shown in a cyan space-filling representation. (C) Superposition of stick representations of the 8:0 LacCer (carbon atoms colored in cyan) and 18:1 LacCer (carbon atoms colored in lavender) derived from their sphingosine-out and sphingosine-in GLTP complexes, respectively.
Figure 11
Figure 11. Schematic Highlighting Positions of Lipid Chains and Extraneous Hydrocarbons in GSL-GLTP Complexes
The assembly of bound glycolipids and extraneous hydrocarbons, if present in the GLTP tunnel, are shown. The bordered segment labeled 1 encompasses the sugar- and amide-binding site on the GLTP, whereas bordered segments 2 and 3 span lipid-binding sites within the hydrophobic GLTP tunnel. The narrow bottom of the GLTP tunnel is schematically represented by a transparent cylinder, labeled 2. The segment labeled 3 is collapsed in apo-GLTP and its complex with n-hexyl-β-d-glucoside. The glycolipid atoms are colored red and blue for oxygen and nitrogen atoms, respectively, and by specific colors for carbon and extraneous hydrocarbons. Specific colors are green for 24:1 GalCer, cyan for 8:0 LacCer, lavender for 18:1 LacCer, lemon for 18:2 GalCer, and silver for extraneous hydrocarbons accompanying 8:0 LacCer, 18:2 LacCer, and apo-GLTP. The longest extraneous hydrocarbon, which is the only one entering the region labeled 3, accompanies 8:0 LacCer.

Comment in

Similar articles

Cited by

References

    1. Hakomori SI. The glycosynapse. Proc Natl Acad Sci U S A. 2002;99:225–232. - PMC - PubMed
    1. Dwek RA, Butters TD, Platt FM, Zitzmann N. Targeting glycosylation as a therapeutic approach. Nat Rev Drug Discov. 2002;1:65–75. - PubMed
    1. Yamashita T, Wada R, Sasaki T, Deng C, Bierfreund U, et al. A vital role for glycosphingolipid synthesis during development and differentiation. Proc Natl Acad Sci U S A. 1999;96:9142–9147. - PMC - PubMed
    1. Kozireski-Chuback D, Wu G, Ledeen RW. Upregulation of nuclear GM1 accompanies axon-like, but not dendrite-like, outgrowth in NG108–15 cells. J Neurosci Res. 1999;55:107–118. - PubMed
    1. Rippo MR, Malisan F, Ravagnan L, Tomassini B, Condo I, et al. GD3 ganglioside directly targets mitochondria in a bcl-2-controlled fashion. FASEB J. 2000;14:2047–2054. - PubMed

Publication types