

A high-resolution single nucleotide polymorphism genetic map of the mouse genome
- PMID: 17105354
- PMCID: PMC1635748
- DOI: 10.1371/journal.pbio.0040395
A high-resolution single nucleotide polymorphism genetic map of the mouse genome
Abstract
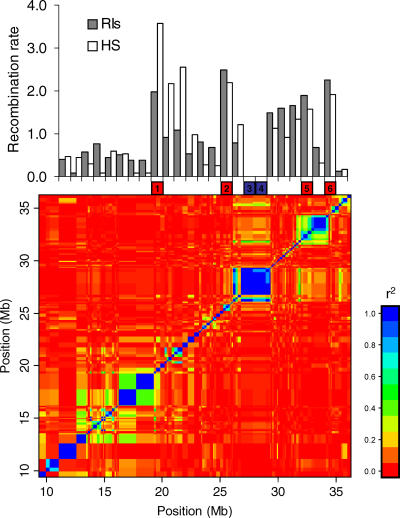
High-resolution genetic maps are required for mapping complex traits and for the study of recombination. We report the highest density genetic map yet created for any organism, except humans. Using more than 10,000 single nucleotide polymorphisms evenly spaced across the mouse genome, we have constructed genetic maps for both outbred and inbred mice, and separately for males and females. Recombination rates are highly correlated in outbred and inbred mice, but show relatively low correlation between males and females. Differences between male and female recombination maps and the sequence features associated with recombination are strikingly similar to those observed in humans. Genetic maps are available from http://gscan.well.ox.ac.uk/#genetic_map and as supporting information to this publication.
Conflict of interest statement
Competing interests. The authors have declared that no competing interests exist.
Figures


Comment in
-
Evidence of a large-scale functional organization of Mammalian chromosomes.PLoS Biol. 2007 May;5(5):e127; author reply e128. doi: 10.1371/journal.pbio.0050127. PLoS Biol. 2007. PMID: 17503963 Free PMC article. No abstract available.
-
Building a better mouse map.PLoS Biol. 2006 Dec;4(12):e422. doi: 10.1371/journal.pbio.0040422. Epub 2006 Nov 14. PLoS Biol. 2006. PMID: 20076509 Free PMC article. No abstract available.
Similar articles
-
A genetic map of the mouse suitable for typing intraspecific crosses.Genetics. 1992 Jun;131(2):423-47. doi: 10.1093/genetics/131.2.423. Genetics. 1992. PMID: 1353738 Free PMC article.
-
Mouse chromosome 16.Mamm Genome. 1992;3 Spec No:S233-40. doi: 10.1007/BF00648434. Mamm Genome. 1992. PMID: 1498436 Review. No abstract available.
-
Single-strand conformational polymorphism (SSCP) mapping of the mouse genome: integration of the SSCP, microsatellite, and gene maps of mouse chromosome 1.Genomics. 1993 Dec;18(3):510-9. doi: 10.1016/s0888-7543(11)80007-8. Genomics. 1993. PMID: 8307560
-
A high-density SNP-based linkage map of the chicken genome reveals sequence features correlated with recombination rate.Genome Res. 2009 Mar;19(3):510-9. doi: 10.1101/gr.086538.108. Epub 2008 Dec 16. Genome Res. 2009. PMID: 19088305 Free PMC article.
-
Mouse chromosome 19.Mamm Genome. 1992;3 Spec No:S266-73. Mamm Genome. 1992. PMID: 1498439 Review. No abstract available.
Cited by
-
Fifteen years of genomewide scans for selection: trends, lessons and unaddressed genetic sources of complication.Mol Ecol. 2016 Jan;25(1):5-23. doi: 10.1111/mec.13339. Epub 2015 Sep 16. Mol Ecol. 2016. PMID: 26224644 Free PMC article. Review.
-
Genome Duplication Increases Meiotic Recombination Frequency: A Saccharomyces cerevisiae Model.Mol Biol Evol. 2021 Mar 9;38(3):777-787. doi: 10.1093/molbev/msaa219. Mol Biol Evol. 2021. PMID: 32898273 Free PMC article.
-
High-throughput genetic mapping of mutants via quantitative single nucleotide polymorphism typing.Genetics. 2010 Jan;184(1):19-26. doi: 10.1534/genetics.109.107557. Epub 2009 Nov 2. Genetics. 2010. PMID: 19884313 Free PMC article.
-
Mapping meiotic single-strand DNA reveals a new landscape of DNA double-strand breaks in Saccharomyces cerevisiae.PLoS Biol. 2007 Dec;5(12):e324. doi: 10.1371/journal.pbio.0050324. PLoS Biol. 2007. PMID: 18076285 Free PMC article.
-
Serious limitations of the QTL/microarray approach for QTL gene discovery.BMC Biol. 2010 Jul 12;8:96. doi: 10.1186/1741-7007-8-96. BMC Biol. 2010. PMID: 20624276 Free PMC article.
References
-
- Dietrich WF, Miller J, Steen R, Merchant MA, Damron-Boles D, et al. A comprehensive genetic map of the mouse genome. Nature. 1996;380:149–152. - PubMed
-
- European Backcross Collaborative Group. Towards high resolution maps of the mouse and human genomes—a facility for ordering markers to 0.1 cM resolution. Hum Mol Genet. 1994;3:621–627. - PubMed
-
- Rhodes M, Straw R, Fernando S, Evans A, Lacey T, et al. A high-resolution microsatellite map of the mouse genome. Genome Res. 1998;8:531–542. - PubMed
-
- Waterston RH, Lindblad-Toh K, Birney E, Rogers J, Abril JF, et al. Initial sequencing and comparative analysis of the mouse genome. Nature. 2002;420:520–562. - PubMed
-
- Lindblad-Toh K, Winchester E, Daly MJ, Wang DG, Hirschhorn JN, et al. Large-scale discovery and genotyping of single-nucleotide polymorphisms in the mouse. Nat Genet. 2000;24:381–386. - PubMed
Publication types
MeSH terms
Grants and funding
LinkOut - more resources
Full Text Sources
Other Literature Sources
