

Information content of data types in time-domain optical tomography
- PMID: 17106455
- PMCID: PMC2585371
- DOI: 10.1364/josaa.23.002989
Information content of data types in time-domain optical tomography
Abstract
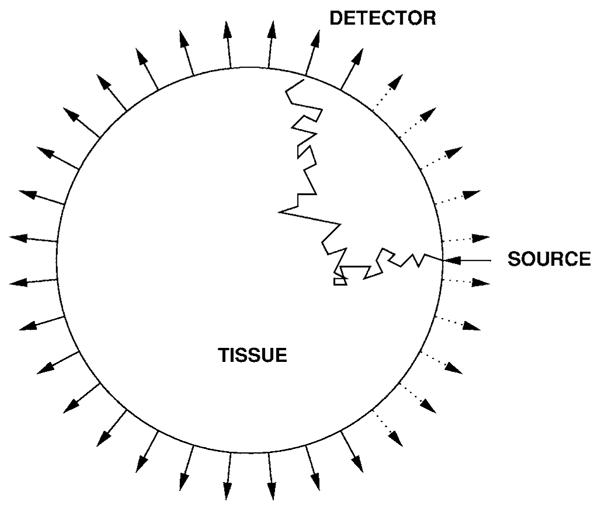
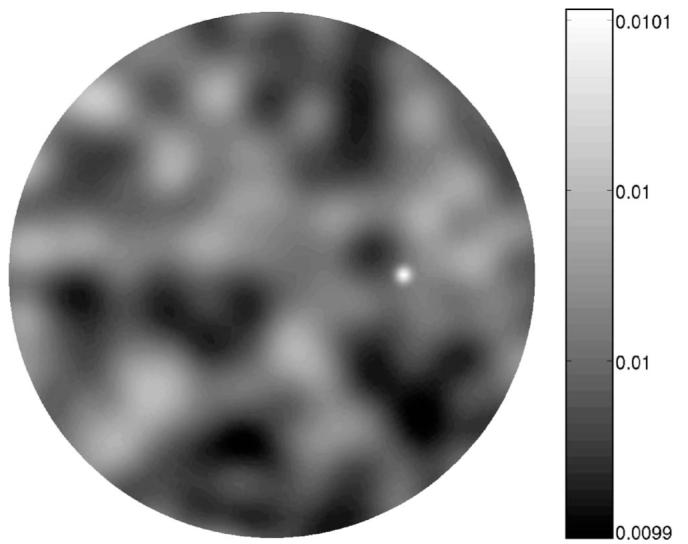
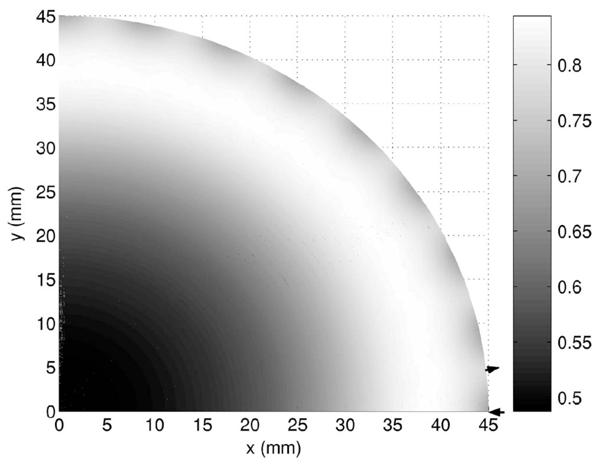
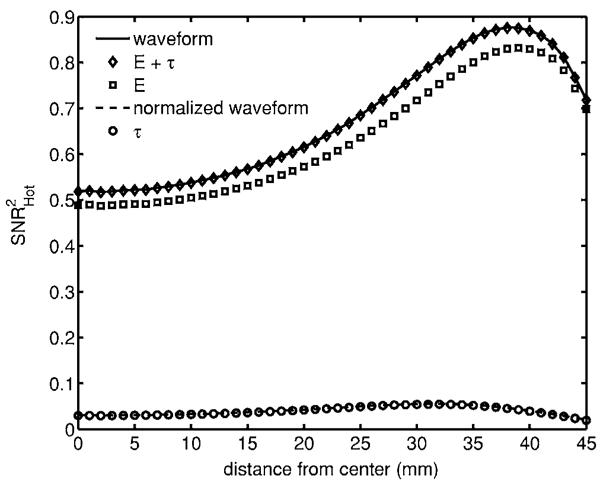
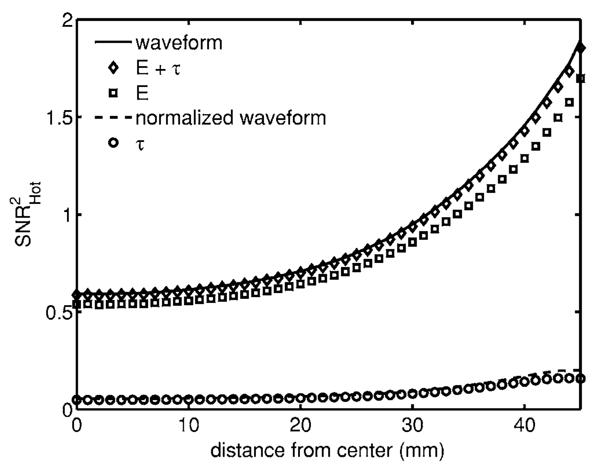
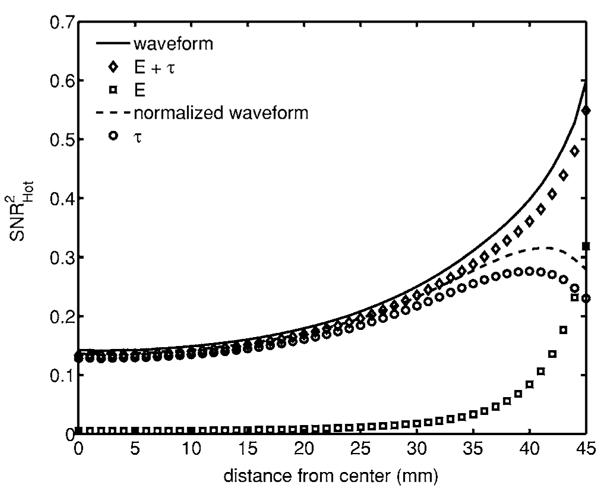
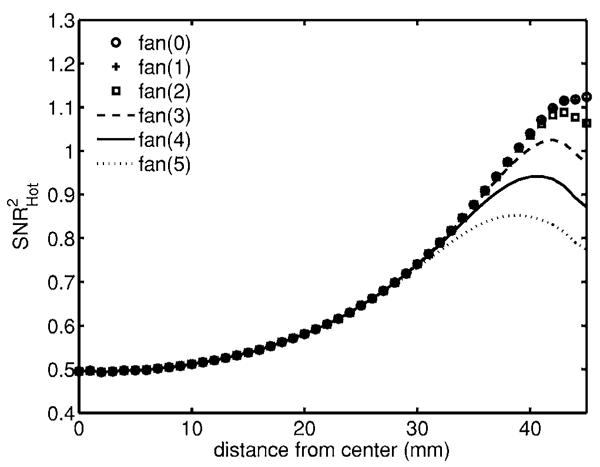
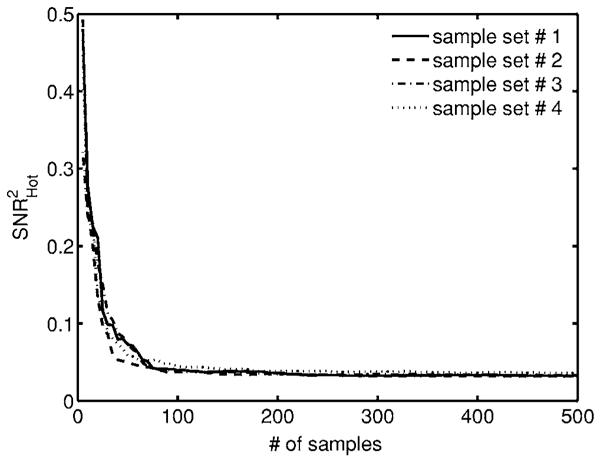
The information content of data types in time-domain optical tomography is quantified by studying the detectability of signals in the attenuation and reduced scatter coefficients. Detection in both uniform and structured backgrounds is considered, and our results show a complex dependence of spatial detectability maps on the type of signal, data type, and background. In terms of the detectability of lesions, the mean time of arrival of photons and the total number of counts effectively summarize the information content of the full temporal waveform. A methodology for quantifying information content prior to reconstruction without assumptions of linearity is established, and the importance of signal and background characterization is highlighted.
Figures
Similar articles
-
Experimental demonstration of an analytic method for image reconstruction in optical diffusion tomography with large data sets.Opt Lett. 2005 Dec 15;30(24):3338-40. doi: 10.1364/ol.30.003338. Opt Lett. 2005. PMID: 16389824
-
Fluorescence-lifetime-based tomography for turbid media.Opt Lett. 2005 Dec 15;30(24):3347-9. doi: 10.1364/ol.30.003347. Opt Lett. 2005. PMID: 16389827
-
Diffuse optical tomographic reconstruction using multifrequency data.J Biomed Opt. 2006 Sep-Oct;11(5):054008. doi: 10.1117/1.2363370. J Biomed Opt. 2006. PMID: 17092157
-
Image analysis methods for diffuse optical tomography.J Biomed Opt. 2006 May-Jun;11(3):33001. doi: 10.1117/1.2209908. J Biomed Opt. 2006. PMID: 16822050 Review.
-
Hierarchical clustering method to improve transrectal ultrasound-guided diffuse optical tomography for prostate cancer imaging.Acad Radiol. 2014 Feb;21(2):250-62. doi: 10.1016/j.acra.2013.11.003. Acad Radiol. 2014. PMID: 24439338 Free PMC article. Review.
Cited by
-
Time-gated perturbation Monte Carlo for whole body functional imaging in small animals.Opt Express. 2009 Oct 26;17(22):19566-79. doi: 10.1364/OE.17.019566. Opt Express. 2009. PMID: 19997176 Free PMC article.
-
Noise characteristics of heterodyne/homodyne frequency-domain measurements.J Biomed Opt. 2012 Jan;17(1):015002. doi: 10.1117/1.JBO.17.1.015002. J Biomed Opt. 2012. PMID: 22352646 Free PMC article.
-
Implicit and explicit prior information in near-infrared spectral imaging: accuracy, quantification and diagnostic value.Philos Trans A Math Phys Eng Sci. 2011 Nov 28;369(1955):4531-57. doi: 10.1098/rsta.2011.0228. Philos Trans A Math Phys Eng Sci. 2011. PMID: 22006905 Free PMC article. Review.
-
Estimation of channelized hotelling observer performance with known class means or known difference of class means.IEEE Trans Med Imaging. 2009 Aug;28(8):1198-207. doi: 10.1109/TMI.2009.2012705. Epub 2009 Jan 19. IEEE Trans Med Imaging. 2009. PMID: 19164081 Free PMC article.
-
Modeling human observer detection in undersampled magnetic resonance imaging reconstruction with total variation and wavelet sparsity regularization.J Med Imaging (Bellingham). 2023 Jan;10(1):015502. doi: 10.1117/1.JMI.10.1.015502. Epub 2023 Feb 25. J Med Imaging (Bellingham). 2023. PMID: 36852415 Free PMC article.
References
-
- Gibson AP, Hebden JC, Arridge SR. Recent advances in diffuse optical tomography. Phys. Med. Biol. 2005;50:R1–R43. - PubMed
-
- Schmidt FEW, Fry ME, Hillman EMC, Hebden JC, Delpy DT. A 32-channel time-resolved instrument for medical optical tomography. Rev. Sci. Instrum. 2000;71:256–265.
-
- Pogue BW, Testorf M, McBride T, Osterberg U, Paulsen K. Instrumentation and design of a frequency-domain diffuse optical tomography imager for breast cancer detection. Opt. Express. 1997;1:391–403. - PubMed
-
- Schweiger M, Gibson AP, Arridge SR. Computational aspects of diffuse optical tomography. IEEE Comput. Sci. Eng. 2003;5:33–41.
-
- Hebden JC, Arridge SR, Delpy DT. Optical imaging in medicine: I. Experimental techniques. Phys. Med. Biol. 1997;42:825–840. - PubMed
Publication types
MeSH terms
Grants and funding
LinkOut - more resources
Full Text Sources
