. 2007 Feb;81(3):1472-8.
doi: 10.1128/JVI.02122-06. Epub 2006 Nov 15.

Human immunodeficiency virus type 1 matrix protein assembles on membranes as a hexamer

Affiliations

Human immunodeficiency virus type 1 matrix protein assembles on membranes as a hexamer

Ayna Alfadhli et al. J Virol. 2007 Feb.

Abstract

The membrane-binding matrix (MA) domain of the human immunodeficiency virus type 1 (HIV-1) structural precursor Gag (PrGag) protein oligomerizes in solution as a trimer and crystallizes in three dimensions as a trimer unit. A number of models have been proposed to explain how MA trimers might align with respect to PrGag capsid (CA) N-terminal domains (NTDs), which assemble hexagonal lattices. We have examined the binding of naturally myristoylated HIV-1 matrix (MyrMA) and matrix plus capsid (MyrMACA) proteins on membranes in vitro. Unexpectedly, MyrMA and MyrMACA proteins both assembled hexagonal cage lattices on phosphatidylserine-cholesterol membranes. Membrane-bound MyrMA proteins did not organize into trimer units but, rather, organized into hexamer rings. Our results yield a model in which MA domains stack directly above NTD hexamers in immature particles, and they have implications for HIV assembly and interactions between MA and the viral membrane glycoproteins.


Figures
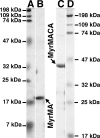
FIG. 1.
FIG. 1.
Purification of MyrMA and MyrMACA proteins. MyrMA (lane B) and MyrMACA (lane C) proteins were coexpressed with yeast NMT in bacteria and purified under conditions shown to yield only trace amounts of unmyristoylated products. The purified proteins were subjected to SDS-PAGE in parallel with protein markers (lanes A and D) and visualized by staining with Coomassie blue. The purified proteins retain C-terminal six-histidine tags and have calculated molecular masses of 16 kDa for MyrMA and 41 kDa for MyrMACA (note that the MyrMA protein migrates slightly slower than the 17-kDa marker protein in this gel system). Identities of the proteins were verified by immunoblotting using primary antibodies to HIV-1 CA and MA, and myristoylation of MyrMA was confirmed by mass spectrometry as described in Materials and Methods.
FIG. 2.
FIG. 2.
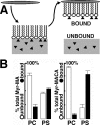
Monolayer membrane binding assays. (A) Binding of MyrMA and MyrMACA proteins to membrane monolayers was performed by incubation of proteins in buffer beneath membrane monolayers formed at the air-buffer interface. After incubations, monolayers and bound proteins were lifted onto Parafilm circles, while unbound proteins remained in the buffer subphase. Bound and unbound samples were processed for SDS-PAGE, detected by immunoblotting, and quantitated densitometrically. (B) The percentages of total MyrMA or MyrMACA protein measured in unbound (white bars) and membrane-bound (black bars) fractions are shown. Membrane monolayers were composed of 4:1 (wt/wt) phospholipid-cholesterol mixes containing PC or PS. Averages and standard deviations are derived from two (MyrMA) or three (MyrMACA) experiments, and unlabeled y-axis markers correspond to 25%, 50%, and 75% of the total protein.
FIG. 3.
FIG. 3.
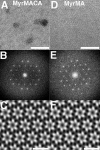
Comparison of MyrMACA and MyrMA membrane-bound projection structures. MyrMACA (A to C) and MyrMA (D to F) proteins were assembled onto lipid monolayers composed of 4:1 PS-cholesterol, lifted onto lacey carbon grids, and negatively stained. (A and D) Crystalline areas on membrane monolayers were imaged by low-dose transmission EM; bars indicate 100 nm. (B and E) Crystalline areas from raw images were boxed and Fourier transformed and are displayed as calculated diffraction patterns (power spectra). (C and F) Average projection images of membrane-bound proteins were obtained by merging seven data sets for each protein to a resolution of 18 Å, assuming p6 symmetry, as described in Materials and Methods. Proteins appear white and are viewed from the membrane side down. Size bars indicate 100 Å.
FIG. 4.
FIG. 4.
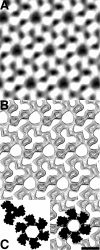
Projection structure of unstained, membrane-bound MyrMA. MyrMA proteins were assembled onto lipid monolayers composed of 4:1 PS-cholesterol, lifted onto lacey carbon grids, plunge-frozen in liquid ethane, and imaged at −176°C to −180°C under low-dose conditions. (A) A crystalline area was boxed, Fourier transformed, indexed, and back transformed with no symmetry constraints (p1) using amplitude and phase data from the lattice points to generate a Fourier-filtered 2D projection image. Proteins appear white and are viewed from a perspective above and perpendicular to the membrane. (B) A contour map was prepared from the 2D projection image by combining the 256 gray scale values into 32 bins and displaying the 20 highest contours. (C) The HIV-1 MA trimer structure from PDB entry 1HIW was scaled to the dimensions of the projection images and is viewed from the putative membrane side down. The hexamer model was produced using a monomer extracted from the trimer unit and was hand fitted to a hexamer ring from the contour map. The size bar for all panels is 50Å.
FIG. 5.
FIG. 5.
Locations of MA mutations that impair envelope protein incorporation into virions. (A) A hexamer model of MA was produced using a monomer extracted from the HIV-1 MA trimer structure from PDB entry 1H1W (23) and is viewed from its putative membrane-binding face. Indicated in red are the sites of four residues that, when mutated, reduce HIV-1 envelope protein assembly into virus particles (12, 16, 17). (B) Depicted in red are the locations of MA residues that, when deleted (13, 58), mutated in pairs (13), or mutated singly (12, 16, 17) reduce envelope protein incorporation into virions.

References

    1. Alfadhli, A., T. Dhenub, A. Still, and E. Barklis. 2005. Analysis of human immunodeficiency virus type 1 Gag dimerization-induced assembly. J. Virol. 79:14498-14506. - PMC - PubMed
    1. Amos, L., R. Henderson, and P. Unwin. 1982. Three-dimensional structure determination by electron microscopy of two-dimensional crystals. Prog. Biophys. Mol. Biol. 39:183-231. - PubMed
    1. Barklis, E., J. McDermott, S. Wilkens, E. Schabtach, M. F. Schmid, S. Fuller, S. Karanjia, Z. Love, R. Jones, Y. Rui, Z. Zhao, and D. Thompson. 1997. Structural analysis of membrane-bound retrovirus capsid proteins. EMBO J. 16:1199-1213. - PMC - PubMed
    1. Barklis, E., J. McDermott, S. Wilkens, S. Fuller, and D. Thompson. 1998. Organization of HIV-1 capsid proteins on a lipid monolayer. J. Biol. Chem. 273:7177-7180. - PubMed
    1. Bouamr, F., S. Scarlata, and C. Carter. 2003. Role of myristoylation in HIV-1 Gag assembly. Biochemistry 42:6408-6417. - PubMed

Publication types

LinkOut - more resources