. 2006 Nov 15;26(46):12089-99.
doi: 10.1523/JNEUROSCI.3047-06.2006.

Leukemia inhibitory factor promotes neural stem cell self-renewal in the adult brain

Affiliations

Leukemia inhibitory factor promotes neural stem cell self-renewal in the adult brain

Sylvian Bauer et al. J Neurosci. .

Abstract

Although neural stem cells (NSCs) persist in various areas of the adult brain, their contribution to brain repair after injury is very limited. Treatment with exogenous growth factors can mitigate this limitation, suggesting that the brain environment is normally deficient in permissive cues and that it may be possible to stimulate the latent regenerative potential of endogenous progenitors with appropriate signals. We analyzed the effects of overexpressing the cytokine leukemia inhibitory factor (LIF) on adult neurogenesis in the normal brain. We found that LIF reduces neurogenesis in the olfactory bulb and subventricular zone by acting directly on NSCs. LIF appears to promote NSC self-renewal, preventing the emergence of more differentiated cell types. This ultimately leads to an expansion of the NSC pool. Our results have implications for the development of therapeutic strategies for brain repair and suggest that LIF may be useful, in combination with other factors, in promoting regeneration in the adult brain.


Figures
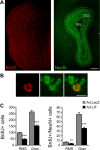
Figure 1.
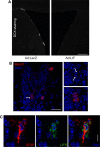
Figure 1.
LIF reduces neurogenesis in the OB. A, Double staining for BrdU and the mature neuronal marker NeuN indicates that most BrdU+ cells are found in the two deepest anatomical layers of the OB: the subependymal layer (SEL) and the granule cell layer (GCL). B, An example of colocalization between BrdU and NeuN. C, The number of BrdU+ cells, as well as the number of newly generated neurons (BrdU+/NeuN+), is reduced by 41–51% in animals overexpressing LIF (Ad:LIF) compared with controls (Ad:LacZ), whereas the percentage of newly generated neurons is unchanged (6.3 ± 0.8 vs 7.2 ± 0.9% and 25.0 ± 1.4 vs 23.5 ± 1.4% in Ad:LacZ- vs Ad:LIF-treated animals in the SEL and GCL, respectively; p = 0.2). Data are mean ± SEM of n = 5 animals per group (2–3 sections analyzed per animal). **p < 0.01 and ***p < 0.001 compared with Ad:LacZ-treated controls (Student's t test). Scale bars: A, 300 μm; B, 10 μm. RMS, Rostral migratory stream; Gran, granule cell layer.
Figure 2.
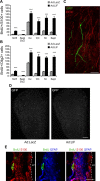
Figure 2.
LIF reduces cell proliferation in the SVZ. A, Double staining for BrdU and the endogenous cell-cycle marker Ki67 is shown on representative sections from a control animal (Ad:LacZ) and an animal overexpressing LIF (Ad:LIF). CC, Corpus callosum; St, striatum; LV, lateral ventricle. Note the highly organized aspect of the SVZ in the control animal compared with treatment with Ad:LIF, in which fewer labeled cells are seen in the SVZ, but more in periventricular areas. B, Higher magnification of SVZ cells double stained with BrdU and Ki67. C, D, Quantification of BrdU+ (C) and Ki67+ (D) cells is shown for various brain regions at the anatomical level analyzed (between +0.3 and +0.7 mm anterior to bregma). There is a 53–55% reduction in both classes of labeled cells in the SVZ of Ad:LIF-treated animals. In contrast, LIF overexpression triggers an increase in BrdU+ as well as Ki67+ cells in periventricular areas [CC, St, and septum (Sept)] and the cortex (Cx). Data are mean ± SEM of n = 5 animals per group (2–3 sections analyzed per animal). *p < 0.05 and ***p < 0.001 compared with Ad:LacZ-treated controls (Student's t test). Sept SVZ, The ependyma lining the septal side of the lateral ventricle. Scale bars: A, 150 μm; B, 15 μm.
Figure 3.
Figure 3.
LIF reduces neuronal differentiation in the SVZ, and LIFR is expressed by some SVZ astrocytes. A, Dcx-expressing neuroblasts (type A cells) are greatly reduced in the SVZ of animals treated with Ad:LIF (see Results for image analysis data). B, High magnification of SVZ cells stained with Mash1, a marker of transit-amplifying, type C cells. Note the mitosis (arrows and insets). C, LIFR immunoreactivity is detected on some GFAP-expressing astrocytes in the SVZ. Scale bars: A, 200 μm; B, 30 μm (insets, 15 μm); C, 15 μm.
Figure 4.
Figure 4.
LIF promotes the proliferation or formation of glial progenitors in periventricular areas and in the SVZ. A, B, Quantification of cells coexpressing BrdU and S100 (A) or BrdU and Olig2 (B) indicates that LIF overexpression induces a threefold to fivefold increase in the number of these newly generated glial cells in all brain regions examined, including the SVZ. C, D, A GFP-replication-incompetent retrovirus was injected into the SVZ before treatment with Ad:LacZ (control) or Ad:LIF, and brains were examined 3 weeks after injection. C, A GFP+ neuron in the OB displays dendritic spines but lacks expression of the immature neuron marker Dcx. D, Representative OB sections show that GFP+ cells are concentrated in the center of the OB and are reduced in animals treated with Ad:LIF (see Results for image analysis data). E, In the SVZ of Ad:LIF-treated animals, many cells that are double stained with BrdU and S100 also express GFAP, a marker of NSCs. Data are mean ± SEM of n = 5 animals per group (2–3 sections analyzed per animal). ***p < 0.001 compared with Ad:LacZ-treated controls (Student's t test). Sept SVZ, Ependyma lining the septal side of the lateral ventricle; Cx, cortex; CC, corpus callosum; LV, lateral ventricle; St, striatum; Sept, septum. Scale bars: C, 50 μm; D, 300 μm; E, 10 μm.
Figure 5.
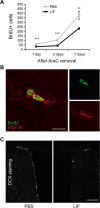
Figure 5.
Infusion of LIF after a 6 d AraC treatment impairs SVZ regeneration in vivo by acting directly on NSCs. A, Quantification of BrdU+ cells in the SVZ indicates that LIF reduces the number of BrdU+ cells at 1, 3, and 7 d after AraC removal. B, High magnification of SVZ cells double stained for BrdU and EGFR, a marker of transit-amplifying cells (type C). C, Representative sections stained with Dcx (a marker of neuroblasts) 7 d after AraC removal/LIF infusion. LIF strongly impairs the reappearance of neuroblasts (see Results for image analysis data). Data are mean ± SEM of n = 3 animals per group (2–3 sections analyzed per animal). **p < 0.01 and ***p < 0.001 compared with PBS-infused controls (Student's t test). Scale bars: B, 15 μm (inset, 30 μm); C, 200 μm.
Figure 6.
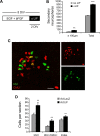
Figure 6.
LIF stimulates the self-renewal of sphere-forming cells in vitro, as well as the renewal of long-term, label-retaining cells in vivo. A, Schematic representation of the protocol used in vitro. Growing neurospheres were incubated with LIF (20 ng/ml) during the last 2 DIV. These neurospheres were then dissociated to assess secondary neurosphere formation. B, Quantification of secondary spheres. Neurospheres pretreated with LIF during the last 2 DIV (from 6 to 8 DIV) yield 70% more secondary neurospheres compared with neurospheres that were not exposed to LIF. This increase is observed on the total population of spheres as well as on larger neurospheres (≥100 μm diameter). C, Pictures illustrate an example of the IdU and CldU double staining. D, LIF induces a 30% increase in the number of long-term, label-retaining cells (IdU+), as well as a twofold increase in the number of long-term, label-retaining cells that reenter the cell cycle (IdU+/CldU+). LIF also increases the proportion of IdU+/CldU+ cells among the total IdU+ cells (Index; i.e., the proportion of self-renewing, long-term, label-retaining cells that reenter the cell cycle). Data are mean ± SEM of n = 3 animals per group (3 sections analyzed per animal) or n = 3–6 wells per condition (independent experiments were performed at least 3 times and gave similar results). **p < 0.01 and ***p < 0.001 compared with Ad:LacZ-treated control animals or spheres incubated without LIF (Student's t test). Scale bar: C, 30 μm (inset, 60 μm).

References

    1. Arvidsson A, Collin T, Kirik D, Kokaia Z, Lindvall O. Neuronal replacement from endogenous precursors in the adult brain after stroke. Nat Med. 2002;8:963–970. - PubMed
    1. Banner LR, Patterson PH. Major changes in the expression of the mRNAs for cholinergic differentiation factor/leukemia inhibitory factor and its receptor after injury to adult peripheral nerves and ganglia. Proc Natl Acad Sci USA. 1994;91:7109–7113. - PMC - PubMed
    1. Banner LR, Moayeri NN, Patterson PH. Leukemia inhibitory factor is expressed in astrocytes following cortical brain injury. Exp Neurol. 1997;147:1–9. - PubMed
    1. Barnabe-Heider F, Wasylnka JA, Fernandes KJ, Porsche C, Sendtner M, Kaplan DR, Miller FD. Evidence that embryonic neurons regulate the onset of cortical gliogenesis via cardiotrophin-1. Neuron. 2005;48:253–265. - PubMed
    1. Bauer S, Patterson PH. The cell cycle-apoptosis connection revisited in the adult brain. J Cell Biol. 2005;171:641–650. - PMC - PubMed

Publication types

MeSH terms