

NF-kappa B binds to the immunoglobulin S gamma 3 region in vivo during class switch recombination
- PMID: 17109470
- PMCID: PMC4979565
- DOI: 10.1002/eji.200636294
NF-kappa B binds to the immunoglobulin S gamma 3 region in vivo during class switch recombination
Abstract
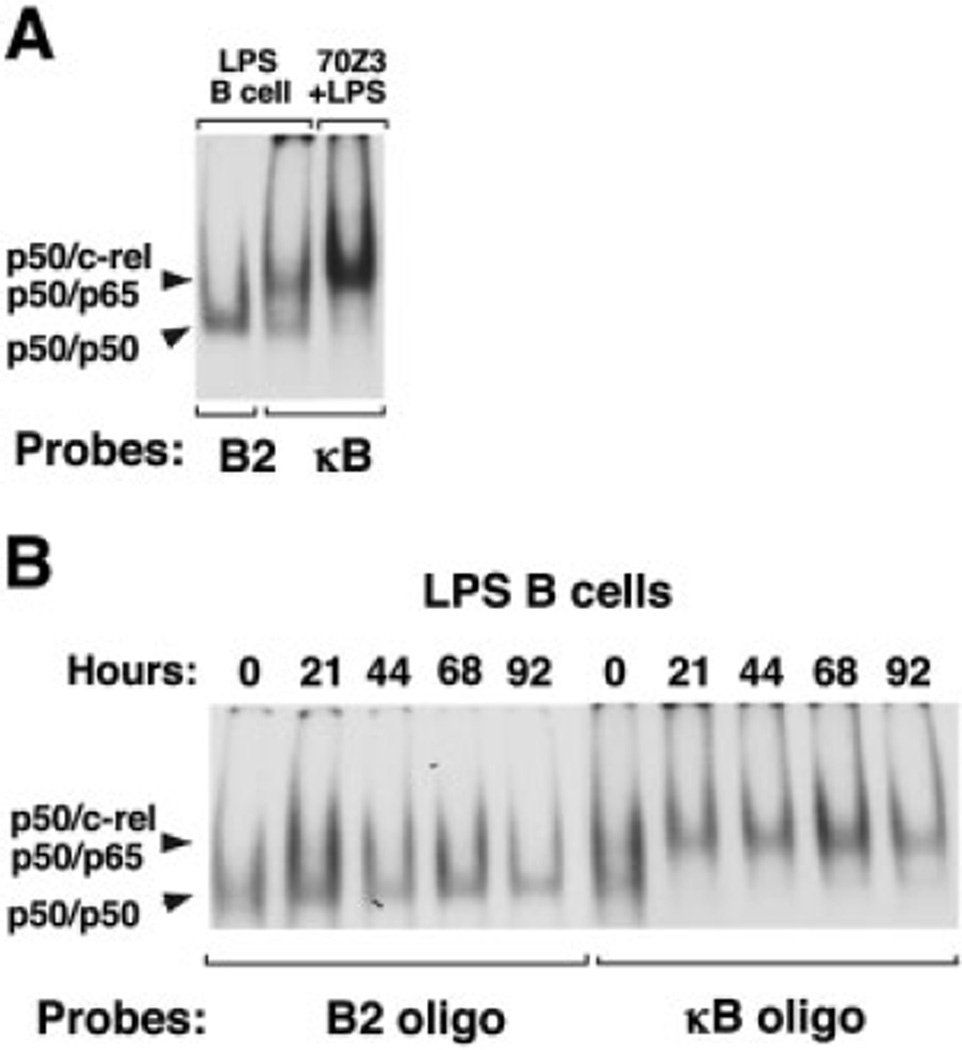
Ig class switch recombination (CSR) is dependent upon the expression of activation-induced deaminase and targeted to specific isotypes by germ-line transcript expression and isotype-specific factors. NF-kappaB plays critical roles in multiple aspects of B cell biology and has been implicated in the mechanism of CSR by in vitro binding assays and altered S/S junctions derived from NF-kappaB p50-deficient mice. However, the pleiotropic contributions of NF-kappaB to gene expression in B cells has made discerning a direct role for NF-kappaB in CSR difficult. We now observe that binding of NF-kappaB components p50 and p65 is detected on Sgamma3 in vivo following lipopolysaccharide (LPS) activation and repressed by LPS + IL-4, suggesting a direct role for this factor in CSR. In vivo footprinting confirms occupancy of a previously defined NF-kappaB recognition site in Sgamma3 with the same temporal kinetics as found in the chromatin immunoprecipitation analysis. Binding of NF-kappaB components p50 and p65 was also detected on Sgamma1 following B cell activation. H3 histone hyper acetylation at Sgamma1 is strongly correlated with NF-kappaB binding, suggesting that NF-kappaB mediates chromatin remodeling in the Sgamma3 and Sgamma1 region.
Figures


Similar articles
-
Mapping of a functional recombination motif that defines isotype specificity for mu-->gamma3 switch recombination implicates NF-kappaB p50 as the isotype-specific switching factor.J Exp Med. 2004 Mar 1;199(5):617-27. doi: 10.1084/jem.20031935. J Exp Med. 2004. PMID: 14993249 Free PMC article.
-
NF-kappa B p50-dependent in vivo footprints at Ig S gamma 3 DNA are correlated with mu-->gamma 3 switch recombination.J Immunol. 2001 Apr 1;166(7):4552-9. doi: 10.4049/jimmunol.166.7.4552. J Immunol. 2001. PMID: 11254712 Free PMC article.
-
B cell Rab7 mediates induction of activation-induced cytidine deaminase expression and class-switching in T-dependent and T-independent antibody responses.J Immunol. 2015 Apr 1;194(7):3065-78. doi: 10.4049/jimmunol.1401896. Epub 2015 Mar 4. J Immunol. 2015. PMID: 25740947 Free PMC article.
-
Current insights into the mechanism of mammalian immunoglobulin class switch recombination.Crit Rev Biochem Mol Biol. 2019 Aug;54(4):333-351. doi: 10.1080/10409238.2019.1659227. Epub 2019 Sep 11. Crit Rev Biochem Mol Biol. 2019. PMID: 31509023 Free PMC article. Review.
-
Accessibility control and machinery of immunoglobulin class switch recombination.J Leukoc Biol. 2003 Mar;73(3):323-32. doi: 10.1189/jlb.0702339. J Leukoc Biol. 2003. PMID: 12629145 Review.
Cited by
-
Dynamic changes in binding of immunoglobulin heavy chain 3' regulatory region to protein factors during class switching.J Biol Chem. 2011 Aug 19;286(33):29303-29312. doi: 10.1074/jbc.M111.243543. Epub 2011 Jun 17. J Biol Chem. 2011. PMID: 21685395 Free PMC article.
-
Binding of LBP-1a to specific immunoglobulin switch regions in vivo correlates with specific repression of class switch recombination.Eur J Immunol. 2009 May;39(5):1387-94. doi: 10.1002/eji.200838226. Eur J Immunol. 2009. PMID: 19384868 Free PMC article.
-
Impaired B cell development and function in the absence of IkappaBNS.J Immunol. 2011 Oct 15;187(8):3942-52. doi: 10.4049/jimmunol.1002109. Epub 2011 Sep 7. J Immunol. 2011. PMID: 21900180 Free PMC article.
-
Roles of the NF-kappaB pathway in lymphocyte development and function.Cold Spring Harb Perspect Biol. 2010 May;2(5):a000182. doi: 10.1101/cshperspect.a000182. Epub 2009 Dec 23. Cold Spring Harb Perspect Biol. 2010. PMID: 20452952 Free PMC article. Review.
-
Sgamma3 switch sequences function in place of endogenous Sgamma1 to mediate antibody class switching.J Exp Med. 2008 Jul 7;205(7):1567-72. doi: 10.1084/jem.20080451. Epub 2008 Jun 9. J Exp Med. 2008. PMID: 18541713 Free PMC article.
References
-
- Gritzmacher CA. Molecular aspects of heavy-chain class switching. Crit. Rev. Immunol. 1989;9:173–200. - PubMed
-
- Kenter AL. Class switch recombination: An emerging mechanism. Curr. Top. Microbiol. Immunol. 2005;290:171–199. - PubMed
-
- Wuerffel RA, Du J, Thompson RJ, Kenter AL. Ig Sgamma3 DNA-specifc double strand breaks are induced in mitogen-activated B cells and are implicated in switch recombination. J. Immunol. 1997;159:4139–4144. - PubMed
-
- Catalan N, Selz F, Imai K, Revy P, Fischer A, Durandy A. The block in immunoglobulin class switch recombination caused by activation-induced cytidine deaminase deficiency occurs prior to the generation of DNA double strand breaks in switch mu region. J. Immunol. 2003;171:2504–2509. - PubMed
Publication types
MeSH terms
Substances
Grants and funding
LinkOut - more resources
Full Text Sources
Molecular Biology Databases
Research Materials
