. 2006 Nov 17:7:506.
doi: 10.1186/1471-2105-7-506.

Visual setup of logical models of signaling and regulatory networks with ProMoT

Affiliations

Visual setup of logical models of signaling and regulatory networks with ProMoT

Julio Saez-Rodriguez et al. BMC Bioinformatics. .

Abstract

Background: The analysis of biochemical networks using a logical (Boolean) description is an important approach in Systems Biology. Recently, new methods have been proposed to analyze large signaling and regulatory networks using this formalism. Even though there is a large number of tools to set up models describing biological networks using a biochemical (kinetic) formalism, however, they do not support logical models.

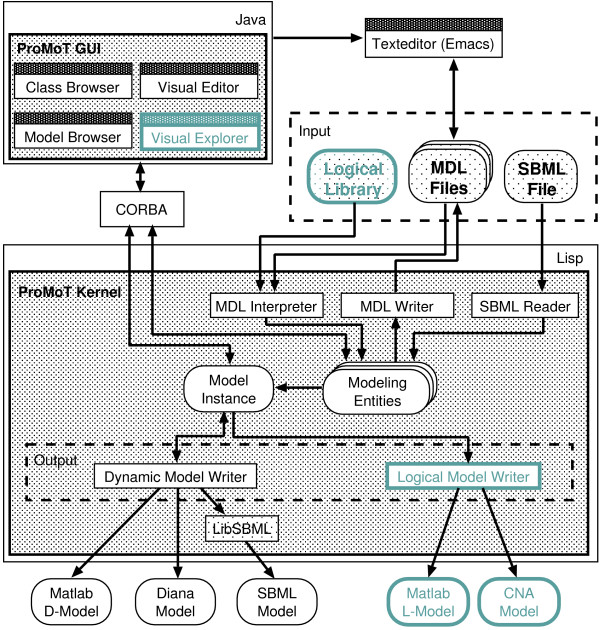
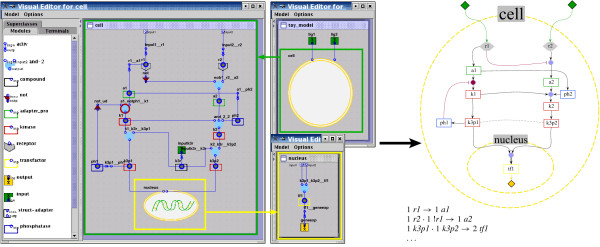
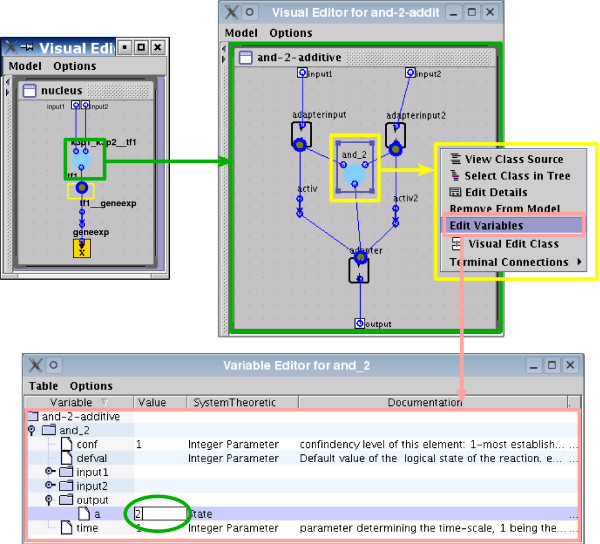
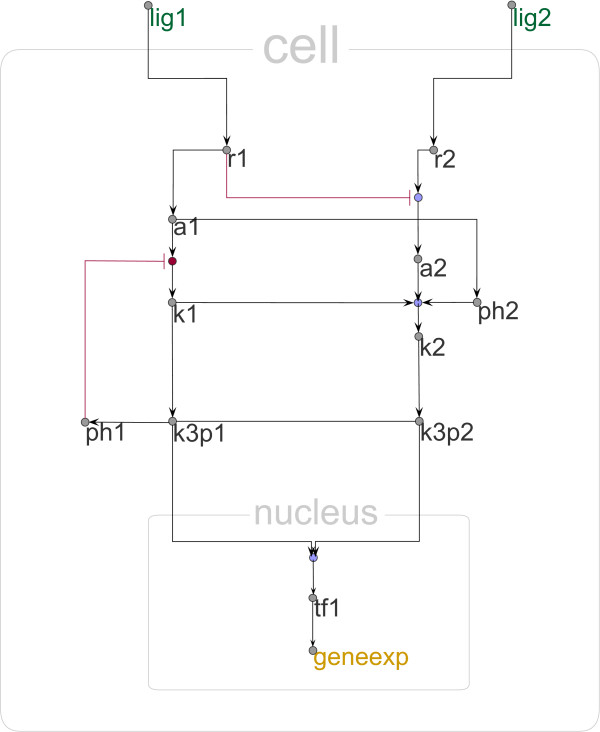
Results: Herein we present a flexible framework for setting up large logical models in a visual manner with the software tool ProMoT. An easily extendible library, ProMoT's inherent modularity and object-oriented concept as well as adaptive visualization techniques provide a versatile environment. Both the graphical and the textual description of the logical model can be exported to different formats.

Conclusion: New features of ProMoT facilitate an efficient set-up of large Boolean models of biochemical interaction networks. The modeling environment is flexible; it can easily be adapted to specific requirements, and new extensions can be introduced. ProMoT is freely available from http://www.mpi-magdeburg.mpg.de/projects/promot/.


Figures

Figure 1
Figure 1
Architecture of ProMoT. Diagram of the software architecture of ProMoT. Added or extended software components are highlighted in green and bold face. Models can be set up either via the GUI or a text editor using the MDL format. The kernel can read and write model representations to files in MDL format. It can also read SBML models for Systems Biology. Internally models are represented as classes with inheritance and aggregation mechanisms. The user can manipulate and visualize these classes via the GUI. For analysis, a model instance is created and processed by one of the different writers for generating the input of an analysis system.
Figure 2
Figure 2
Screenshot of the Visual Editor of a toy model in ProMoT (left) and of its visually processed export (right), (e.g. to CellNetAnalyzer). The text in the bottom of the right figure shows an incomplete textual export (where '!' denotes Not, '·' represents AND, and '→' activation. Note how, in the Visual Editor, inhibition is encoded by a not element between the compound and the gate and, after applying the visual scenario, it is represented by a single red-colored connection line (but could be easily changed to another color value). Additionally, the direction is indicated by an arrow symbol (different for activation and inhibition), which is implicitly defined in the mathematical description. Furthermore, the element k3r has been hidden, since it belongs to the class reservoir and has thus no biological meaning. Complete textual exports, as well as alternative visualizations, can be found in Tables 1-2 and Figure 4, respectively.
Figure 3
Figure 3
Illustration of the setting of parameters by the encoding of multiple levels. Properties like the multilevel variable can be edited in the variable editor. The parameter a (level of activation) default equals 1, and can be modified to encode multilevel logical operations. For example, in the toy model (see Figure 2), tf1 reaches a level 2 if both k3p1 and k3p2 are active. This is set up in ProMoT via a gate of the class AND where the output has a = 2).
Figure 4
Figure 4
Alternative visualizations. Using the concept of visual scenarios the whole network can be visually altered. Here, a new visual scenario towards a more abstract representation is defined as an alternative to the scenario used in Figure 2. All elements are reduced in size (the label is now positioned outside), proteins have a uniform color, connection lines are orthogonalized, and the border of cell and nucleus are de-emphazised to draw the attention to both logical operations and connections.
Figure 5
Figure 5
Screenshot of the toy model exported to CellNetAnalyzer. Both the textual description (see Table 1) and the map of the toy model of Figure 2 were exported and loaded into CNA. Note that the position of the text boxes (x, y) were automatically generated by ProMoT. The figure shows an analysis where the receptor R1 was activated, R2 was not, and the element with a time scale 2 [6] where considered to be inactive. Small text boxes display the signal flows along the hyperarcs (green boxes: fixed values prior to computation; blue boxes: hyperarcs activating a species (signal flow is 1); red boxes: hyperarcs which are not active (signal flow is 0)).
Figure 6
Figure 6
Screenshot of a comprehensive logical model describing T-cell activation. Screenshot of the logical model describing T-cell activation created in ProMoT. The model comprises 94 compound and 124 reactions.

Similar articles

Cited by

References

    1. Thomas R, D'Ari R. Biological Feedback. Boca Raton, CRC Press; 1990.
    1. Chaves M, Albert R, Sontag ED. Robustness and fragility of Boolean models for genetic regulatory networks. J Theor Biol. 2005;235:431–49. doi: 10.1016/j.jtbi.2005.01.023. - DOI - PubMed
    1. Mendoza L, Thieffry D, Alvarez-Buylla E. Genetic control of flower morphogenesis in rabidopsis thaliana: a logical analysis. Bioinformatics. 1999;15:593–606. doi: 10.1093/bioinformatics/15.7.593. - DOI - PubMed
    1. Kaufman M, Andris F, Leo O. A logical analysis of T cell activation and anergy. Proc Natl Acad Sci USA. 1999;96:3894–3899. doi: 10.1073/pnas.96.7.3894. - DOI - PMC - PubMed
    1. Gonzalez A, Naldi A, Sanchez L, Thieffry D, Chaouiya C. GINsim: A software suite for the qualitative modelling, simulation and analysis of regulatory networks. Biosystems. 2006;84:91–100. doi: 10.1016/j.biosystems.2005.10.003. - DOI - PubMed

Publication types

LinkOut - more resources