

Metabotropic suppression of excitation in murine autaptic hippocampal neurons
- PMID: 17110416
- PMCID: PMC2151347
- DOI: 10.1113/jphysiol.2006.117499
Metabotropic suppression of excitation in murine autaptic hippocampal neurons
Abstract
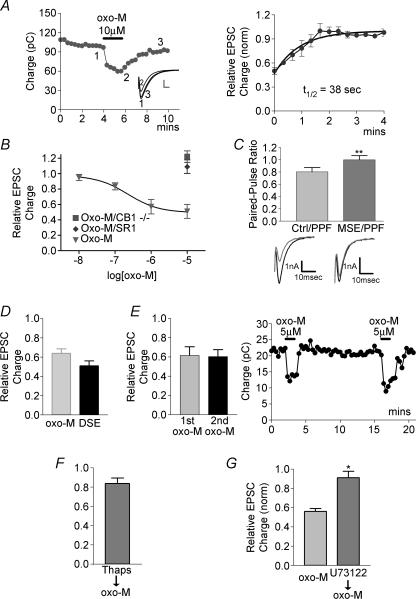
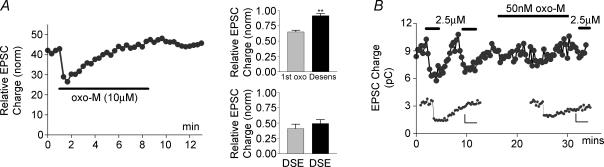
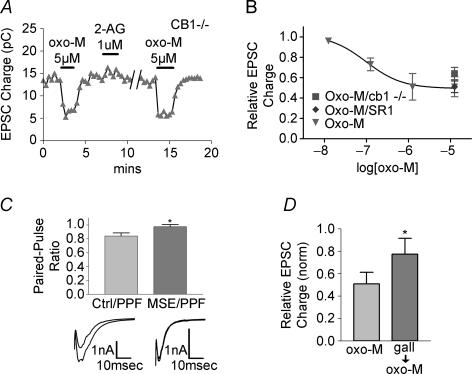
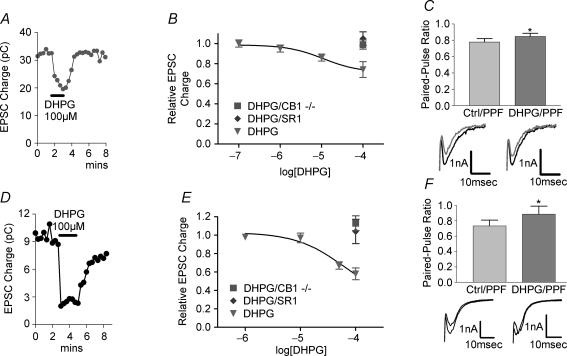
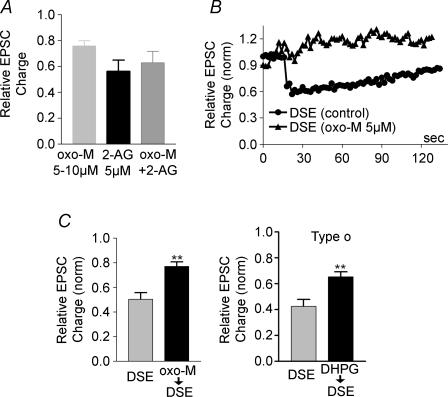
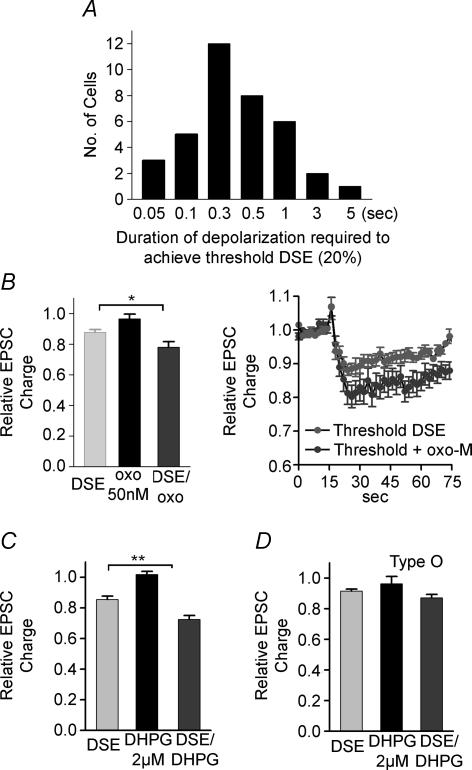
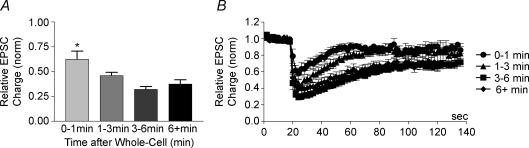
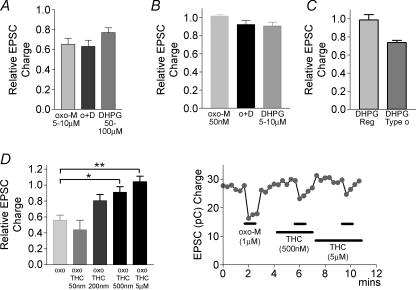
Depolarization-induced suppression of excitation (DSE) and inhibition (DSI) are forms of short-term neuronal plasticity involving postsynaptic release of an endocannabinoid and the activation of presynaptic cannabinoid CB1 receptors. We have recently reported that CB1-dependent DSE can be elicited in autaptic cultures of excitatory hippocampal neurons of the mouse. We now report that the same preparation exhibits a parallel G(q)-coupled receptor-dependent production of endocannabinoids causing retrograde inhibition, also via CB1 receptors, which we will refer to as metabotropic suppression of excitation (MSE). We tested a spectrum of G(q)-coupled receptor agonists and found that both muscarinic and metabotropic glutamate receptors (group I) mediate retrograde inhibition via CB1 receptors in autaptic hippocampal neurons. Thus these neurons possess not only the pre- and postsynaptic machinery necessary for DSE but also that for MSE. This permitted a closer examination of MSE and its interaction with other aspects of the endocannabinoid retrograde signalling machinery: MSE mimics and occludes DSE and is itself occluded by the endocannabinoid 2-arachidonoyl glycerol (2-AG), consistent with 2-AG as a likely mediator of MSE. In contrast to DSE, MSE undergoes heterologous desensitization over the time course of minutes. In keeping with data reported for metabotropic suppression of inhibition (MSI) and DSI in the hippocampus, subthreshold MSE and DSE act synergistically. We additionally found that Delta9-tetrahydrocannabinol, which has been shown to attenuate DSE, antagonizes MSE. Finally, we have distinguished a neuronal subpopulation that exhibits DSE and a differential complement of MSE-mediating Gq-coupled receptors, making possible contrasting studies of MSE. Autaptic endocannabinoid signalling is rich, robust and complex in a deceptively simple package, including a previously unreported postsynaptic mechanism of adaptation in addition to known presynaptic CB1 desensitization. These adaptive sites offer novel targets for modulation of endogenous cannabinoid signalling.
Figures
Similar articles
-
Monoacylglycerol lipase limits the duration of endocannabinoid-mediated depolarization-induced suppression of excitation in autaptic hippocampal neurons.Mol Pharmacol. 2009 Dec;76(6):1220-7. doi: 10.1124/mol.109.059030. Epub 2009 Sep 18. Mol Pharmacol. 2009. PMID: 19767452 Free PMC article.
-
Depolarization-induced suppression of excitation in murine autaptic hippocampal neurones.J Physiol. 2005 Dec 1;569(Pt 2):501-17. doi: 10.1113/jphysiol.2005.091918. Epub 2005 Sep 22. J Physiol. 2005. PMID: 16179366 Free PMC article.
-
Cannabinoid signaling in inhibitory autaptic hippocampal neurons.Neuroscience. 2009 Sep 29;163(1):190-201. doi: 10.1016/j.neuroscience.2009.06.004. Epub 2009 Jun 6. Neuroscience. 2009. PMID: 19501632 Free PMC article.
-
Endocannabinoid-mediated short-term synaptic plasticity: depolarization-induced suppression of inhibition (DSI) and depolarization-induced suppression of excitation (DSE).Br J Pharmacol. 2004 May;142(1):9-19. doi: 10.1038/sj.bjp.0705726. Epub 2004 Apr 20. Br J Pharmacol. 2004. PMID: 15100161 Free PMC article. Review.
-
Retrograde signalling by endocannabinoids.Handb Exp Pharmacol. 2005;(168):367-83. doi: 10.1007/3-540-26573-2_12. Handb Exp Pharmacol. 2005. PMID: 16596781 Review.
Cited by
-
Fmr1 deletion enhances and ultimately desensitizes CB(1) signaling in autaptic hippocampal neurons.Neurobiol Dis. 2013 Aug;56:1-5. doi: 10.1016/j.nbd.2013.04.002. Epub 2013 Apr 9. Neurobiol Dis. 2013. PMID: 23578490 Free PMC article.
-
The CB2-preferring agonist JWH015 also potently and efficaciously activates CB1 in autaptic hippocampal neurons.Pharmacol Res. 2012 Nov;66(5):437-42. doi: 10.1016/j.phrs.2012.08.002. Epub 2012 Aug 14. Pharmacol Res. 2012. PMID: 22921769 Free PMC article.
-
Purine receptor-mediated endocannabinoid production and retrograde synaptic signalling in the cerebellar cortex.Br J Pharmacol. 2011 Feb;162(4):974-88. doi: 10.1111/j.1476-5381.2010.01106.x. Br J Pharmacol. 2011. PMID: 21054344 Free PMC article.
-
Fasting stimulates 2-AG biosynthesis in the small intestine: role of cholinergic pathways.Am J Physiol Regul Integr Comp Physiol. 2015 Oct 15;309(8):R805-13. doi: 10.1152/ajpregu.00239.2015. Epub 2015 Aug 19. Am J Physiol Regul Integr Comp Physiol. 2015. PMID: 26290104 Free PMC article.
-
Monoacylglycerol lipase limits the duration of endocannabinoid-mediated depolarization-induced suppression of excitation in autaptic hippocampal neurons.Mol Pharmacol. 2009 Dec;76(6):1220-7. doi: 10.1124/mol.109.059030. Epub 2009 Sep 18. Mol Pharmacol. 2009. PMID: 19767452 Free PMC article.
References
-
- Edwards DA, Kim J, Alger BE. Multiple mechanisms of endocannabinoid response initiation in hippocampus. J Neurophysiol. 2006;95:67–75. - PubMed
-
- Hashimotodani Y, Ohno-Shosaku T, Tsubokawa H, Ogata H, Emoto K, Maejima T, Araishi K, Shin HS, Kano M. Phospholipase Cbeta serves as a coincidence detector through its Ca2+ dependency for triggering retrograde endocannabinoid signal. Neuron. 2005;45:257–268. - PubMed
Publication types
MeSH terms
Substances
Grants and funding
LinkOut - more resources
Full Text Sources
Other Literature Sources