. 2007 Jan;175(1):361-74.
doi: 10.1534/genetics.106.066811. Epub 2006 Nov 16.

A modified algorithm for the improvement of composite interval mapping

Affiliations

A modified algorithm for the improvement of composite interval mapping

Huihui Li et al. Genetics. 2007 Jan.

Abstract

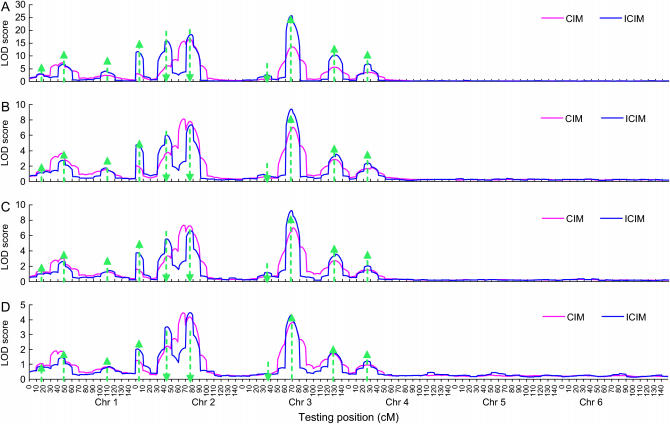
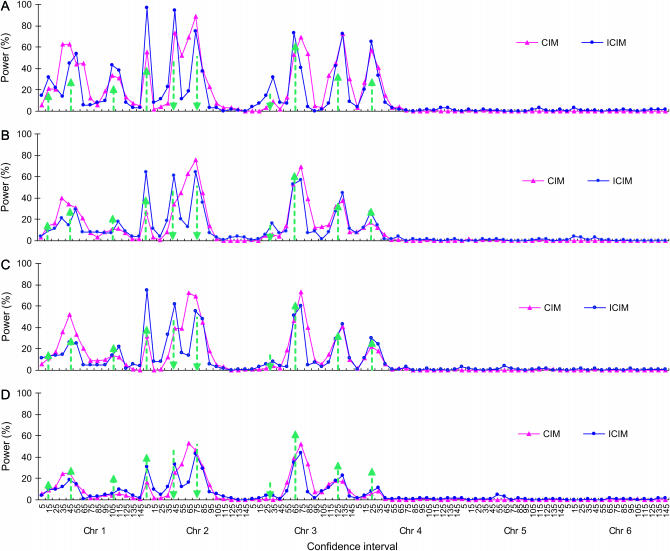
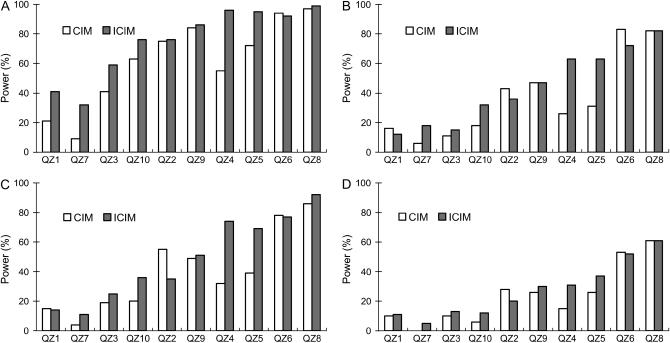
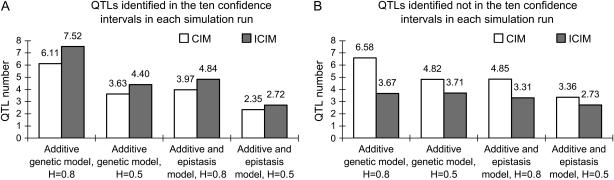
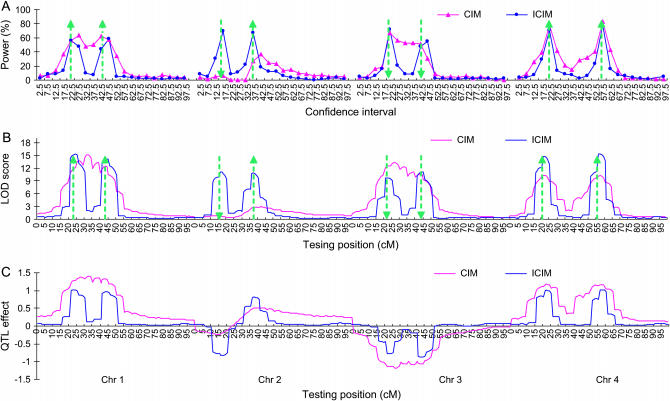
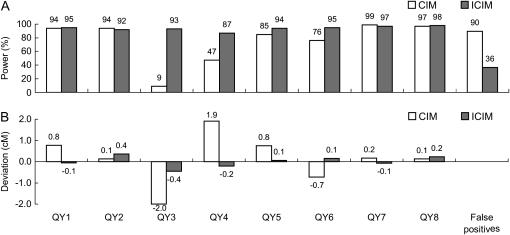
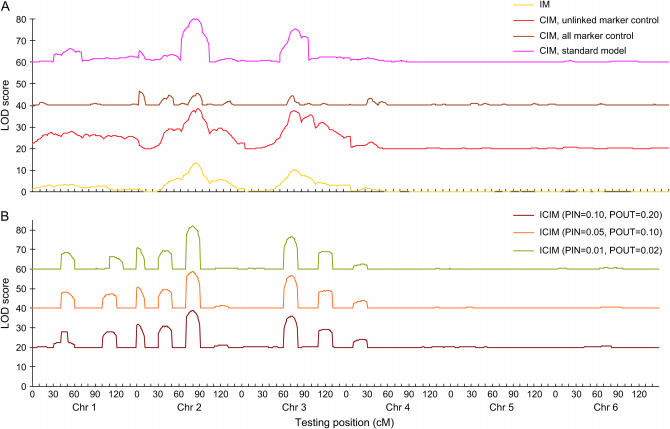
Composite interval mapping (CIM) is the most commonly used method for mapping quantitative trait loci (QTL) with populations derived from biparental crosses. However, the algorithm implemented in the popular QTL Cartographer software may not completely ensure all its advantageous properties. In addition, different background marker selection methods may give very different mapping results, and the nature of the preferred method is not clear. A modified algorithm called inclusive composite interval mapping (ICIM) is proposed in this article. In ICIM, marker selection is conducted only once through stepwise regression by considering all marker information simultaneously, and the phenotypic values are then adjusted by all markers retained in the regression equation except the two markers flanking the current mapping interval. The adjusted phenotypic values are finally used in interval mapping (IM). The modified algorithm has a simpler form than that used in CIM, but a faster convergence speed. ICIM retains all advantages of CIM over IM and avoids the possible increase of sampling variance and the complicated background marker selection process in CIM. Extensive simulations using two genomes and various genetic models indicated that ICIM has increased detection power, a reduced false detection rate, and less biased estimates of QTL effects.


Figures

F<sc>igure</sc> 1.—
Figure 1.—
Average LOD profiles of CIM and ICIM across 100 simulation runs for different genetic models and heritability levels under genome 1. Arrow size and direction represent the approximate effect size and direction of the pointed QTL, respectively. (A–D) Mean LOD profile across 100 runs: (A) additive genetic model, H = 0.8; (B) additive genetic model, H = 0.5; (C) additive and epistasis model, H = 0.8; and (D) additive and epistasis model, H = 0.5.
F<sc>igure</sc> 2.—
Figure 2.—
Power of QTL detection of CIM and ICIM for two genetic models and heritability levels under genome 1. Power was calculated as the proportion of runs that detected the presence of QTL for each of the 90 intervals defined by the 96 markers evenly distributed on six chromosomes. Arrow size and direction represent the approximate effect size and direction of the pointed QTL, respectively. (A) Additive genetic model, H = 0.8. (B) Additive genetic model, H = 0.5. (C) Additive and epistasis model, H = 0.8. (D) Additive and epistasis model, H = 0.5.
F<sc>igure</sc> 3.—
Figure 3.—
Power of QTL detection of CIM and ICIM for two genetic models and heritability levels under genome 1. Power was calculated as the proportion of runs that detected QTL within the interval defined as 5 cM from each side of the predefined QTL. The QTL were rearranged in ascending order by the percentage of variance explained. (A) Additive genetic model, H = 0.8. (B) Additive genetic model, H = 0.5. (C) Additive and epistasis model, H = 0.8. (D) Additive and epistasis model, H = 0.5.
F<sc>igure</sc> 4.—
Figure 4.—
Average number of QTL identified on the 10-cM intervals of the 10 predefined QTL (A) and other chromosome regions (B) for two genetic models and heritability levels under genome 1.
F<sc>igure</sc> 5.—
Figure 5.—
Power of QTL detection (A), average LOD (B), and additive effect (C) profiles across the 100 simulation runs of CIM and ICIM based on genome 2. Power was calculated as the proportion of runs that detected the presence of QTL for each of the 80 intervals defined by 84 markers evenly distributed on four chromosomes. Arrow size and direction represent the approximate effect size and direction of the pointed QTL, respectively.
F<sc>igure</sc> 6.—
Figure 6.—
Power (A) and deviation of position estimation (B) in genome 2 from 100 simulation runs. Each predefined QTL was assigned to a 10-cM interval centered at the true QTL location.
F<sc>igure</sc> 7.—
Figure 7.—
LOD profiles of (A) IM, CIM (with three background marker selection methods), and (B) ICIM (with three probability levels). The first simulated backcross population of 200 individuals was used, where the 10 QTL were additive, and H = 0.8. For clarity, 20, 40, and 60 were added to the LOD scores of CIM with unlinked marker control, of CIM with all marker control, and of CIM standard model control, respectively. Similarly, 20, 40, and 60 were added to the LOD scores of ICIM with PIN = 0.10 and POUT = 0.20, of ICIM with PIN = 0.05 and POUT = 0.10, and of ICIM with PIN = 0.01 and POUT = 0.02, respectively.

References

    1. Ball, R. D., 2001. Bayesian methods for quantitative trait locus mapping based on model selection: approximate analysis using the Bayesian information criterion. Genetics 159: 1351–1364. - PMC - PubMed
    1. Bogdan, M., J. K. Ghosh and R. W. Doerge, 2004. Modifying the Schwarz Bayesian information criterion to locate multiple interacting quantitative trait loci. Genetics 167: 989–999. - PMC - PubMed
    1. Broman, K. W., and T. P. Speed, 2002. A model selection approach for the identification of quantitative trait loci in experimental crosses. J. R. Stat. Soc. B 64: 641–656. - PMC - PubMed
    1. Churchill, G. A., and R. W. Doerge, 1994. Empirical threshold values for quantitative trait mapping. Genetics 138: 963–971. - PMC - PubMed
    1. Dempster, A., N. Laird and D. Rubin, 1977. Maximum likelihood from incomplete data via the EM algorithm. J. R. Stat. Soc. B 39: 1–38.

Publication types

Substances