. 2007 Jan;175(1):375-98.
doi: 10.1534/genetics.106.061457. Epub 2006 Nov 16.

Linkage maps of the dwarf and Normal lake whitefish (Coregonus clupeaformis) species complex and their hybrids reveal the genetic architecture of population divergence

Affiliations

Linkage maps of the dwarf and Normal lake whitefish (Coregonus clupeaformis) species complex and their hybrids reveal the genetic architecture of population divergence

S M Rogers et al. Genetics. 2007 Jan.

Abstract

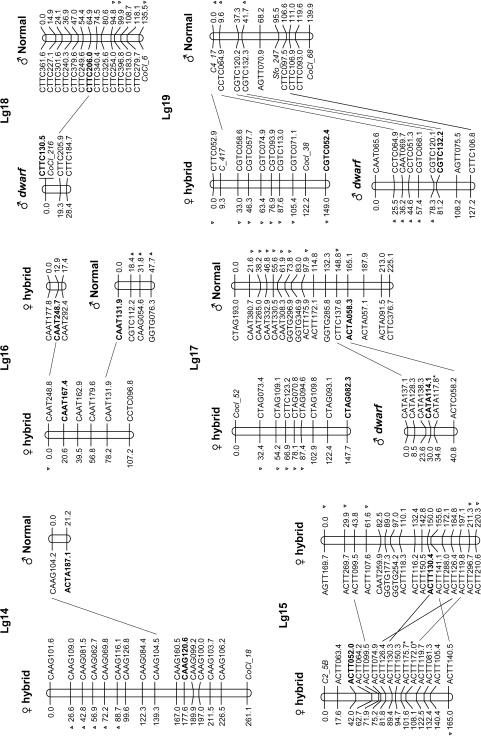
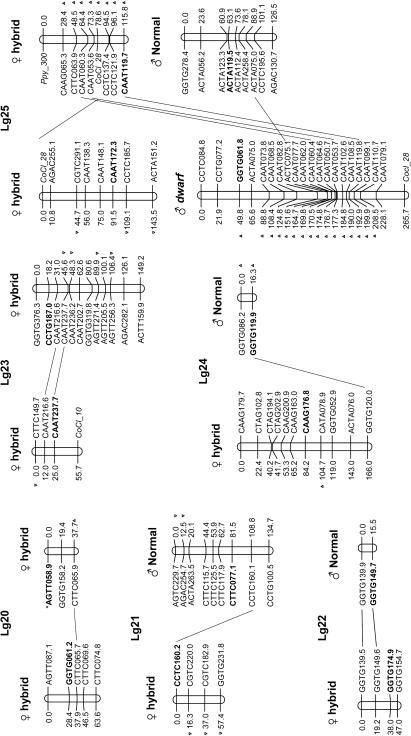
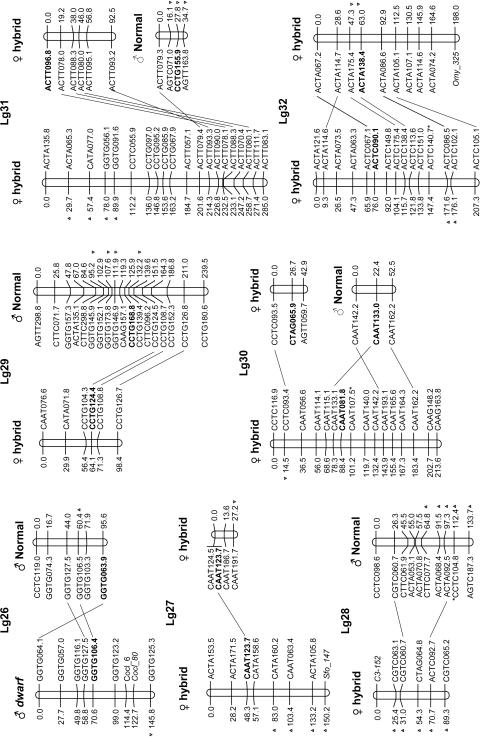
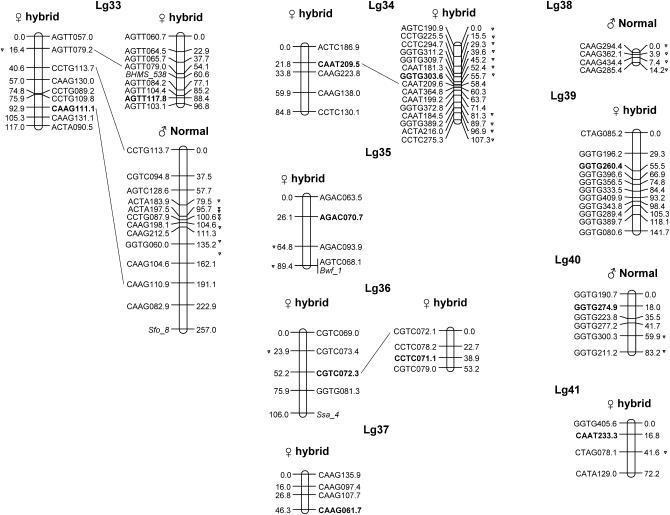
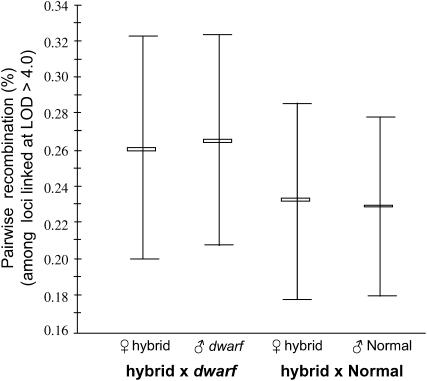
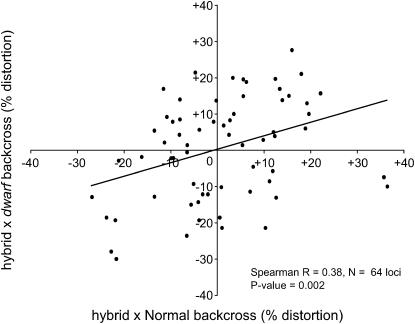
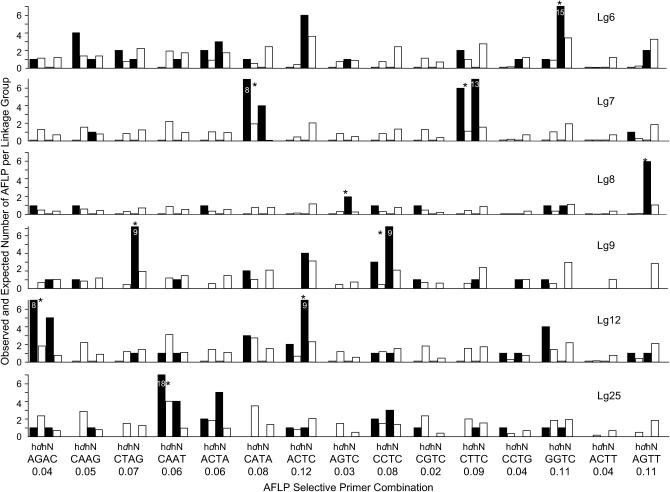
Elucidating the genetic architecture of population divergence may reveal the evolution of reproductive barriers and the genomic regions implicated in the process. We assembled genetic linkage maps for the dwarf and Normal lake whitefish species complex and their hybrids. A total of 877 AFLP loci and 30 microsatellites were positioned. The homology of mapped loci between families supported the existence of 34 linkage groups (of 40n expected) exhibiting 83% colinearity among linked loci between these two families. Classes of AFLP markers were not randomly distributed among linkage groups. Both AFLP and microsatellites exhibited deviations from Mendelian expectations, with 30.4% exhibiting significant segregation distortion across 28 linkage groups of the four linkage maps in both families (P < 0.00001). Eight loci distributed over seven homologous linkage groups were significantly distorted in both families and the level of distortion, when comparing homologous loci of the same phase between families, was correlated (Spearman R = 0.378, P = 0.0021). These results suggest that substantial divergence incurred during allopatric glacial separation and subsequent sympatric ecological specialization has resulted in several genomic regions that are no longer complementary between dwarf and Normal populations issued from different evolutionary glacial lineages.


Figures

F<sc>igure</sc> 1.—
Figure 1.—
Experimental mating scheme employed to generate the two backcross mapping families. The parental generation was sampled in the field as detailed in Lu and Bernatchez (1998) and as such these individuals were no longer available after spawning. The number of gametes was equilibrated in each of the F1 groups generated for the purpose of comparing F1 hybrid inviability.
F<sc>igure</sc> 2.—
Figure 2.—
Sex-specific genetic linkage maps of dwarf, Normal, and hybrid parents in the lake whitefish. Linkage groups on the left side represent the hybrid × dwarf backcross while linkage groups on the right side are from the hybrid × Normal backcross. Homologous loci are indicated by connecting lines between families. Linkage homologies within families (between male and female linkage groups) were implied upon detecting significant linkage in the repulsion phase between sex-specific markers (see materials and methods). Linkage homology between families was inferred by homologous loci that were linked in either family (noted by the lines connecting linkage groups between families). An asterisk next to the locus name indicates conflicting linkage between families. Arrowheads pointing down indicate underrepresented loci while arrowheads pointing up indicate overrepresented loci exhibiting segregation distortion (P < 0.00001). Sex-specific parents are denoted by female (♀) and male (♂); see cross design in Figure 1. Loci assessed as anchors are in boldface type within linkage groups. When possible, linkage group notation was consistent with preliminary linkage associations previously established (Rogers et al. 2001). Microsatellite loci are italicized to distinguish from AFLP loci.
F<sc>igure</sc> 3.—
Figure 3.—
Pairwise recombination frequencies for sex-specific markers between families when calculated among all linked loci exhibiting an LOD >4.0 (but see Table 5 for comparison of mapping distances for homologous sex-specific marker intervals between parents among families).
F<sc>igure</sc> 4.—
Figure 4.—
Comparison of the percentage and direction of segregation distortion, i.e., (frequency of Aa − expected frequency of 0.5) × 100% calculated from the observed segregation ratios for mapped, homologous loci between the hybrid × dwarf and hybrid × Normal backcrosses.
F<sc>igure</sc> 5.—
Figure 5.—
Observed and expected number of AFLP for selective primer combos at homologous linkage groups containing locus information for both sexes. On the x-axis the primer combinations are listed for each family (hd = hybrid × dwarf and hN = hybrid × Normal) while the expected frequency of these loci is listed on the bottom row. A significant cluster of AFLP in one family is denoted by an asterisk on top of the observed column while parallel clusters observed in both families are denoted by an asterisk between observed columns. Numbers within bars represent absolute observed values for significant observations that were higher than the given scale.

Similar articles

Cited by

References

    1. Albertson, R. C., J. T. Streelman and T. D. Kocher, 2003. Directional selection has shaped the oral jaws of Lake Malawi cichlid fishes. Proc. Natl. Acad. Sci. USA 100: 5252–5257. - PMC - PubMed
    1. Albini, G., M. Falque and J. Joets, 2003. ActionMap: a web-based software that automates loci assignments to framework maps. Nucleic Acids Res. 31: 3815–3818. - PMC - PubMed
    1. Angers, B., L. Bernatchez, A. Angers, L. Desgroseillers, 1995. Specific microsatellite loci for brook charr (Salvelinus fontinalis Mitchill) reveals strong population subdivision on microgeographic scale. J. Fish Biol. 47(Suppl. A): 177–185.
    1. Bailey, N. T. J., 1949. The estimation of linkage with differential viability, II and III. Heredity 3: 220–228. - PubMed
    1. Bensch, S., and M. Akesson, 2005. Ten years of AFLP in ecology and evolution: Why so few animals? Mol. Ecol. 14: 2899–2914. - PubMed

Publication types