Comparative Study
. 2006 Dec 7;51(23):6199-211.
doi: 10.1088/0031-9155/51/23/018. Epub 2006 Nov 9.

An analytical algorithm for skew-slit collimator SPECT with uniform attenuation correction

Affiliations
Comparative Study

An analytical algorithm for skew-slit collimator SPECT with uniform attenuation correction

Qiulin Tang et al. Phys Med Biol. .

Abstract

To replace the conventional pinhole (normal cone-beam) collimator, a novel skew-slit collimator was previously proposed and a Novikov-type algorithm developed to reconstruct images using the skew-slit geometry. The goal of this paper is to develop a reconstruction algorithm that has better noise control than the Novikov-type algorithm. The new algorithm is able to compensate for uniform attenuation, and computer simulation results show that reconstructed images are less noisy.


Figures

Figure 1
Figure 1
A skew-slit collimator consists of two tungsten plates. Each plate contains a slit. The two slits are orthogonal to each other.
Figure 2
Figure 2
Each slit consists of focal points of the projection rays.
Figure 3
Figure 3
Illustration of a multi-skew-slit system.
Figure 4
Figure 4
Illustration of the skew-slit backprojection geometry.
Figure 5
Figure 5
Illustration of the boundary factor D.
Figure 6
Figure 6
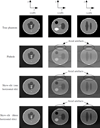
Reconstructed images. The first row shows the true phantom, the second row shows the images reconstructed from the pinhole system, the third row shows the images reconstructed from the skew-slit system and the last row shows the images reconstructed from the multi-skew-slit system. The left column shows the transaxial central-slice (i.e. the orbit plane) images. The middle and right columns show the two orthogonal central-slice images perpendicular to the trajectory.
Figure 7
Figure 7
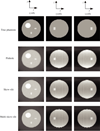
Reconstructed images. The first row shows the true phantom, the second row shows the images reconstructed from the pinhole system, the third row shows the images reconstructed from the skew-slit system and the fourth row shows the images reconstructed from the multi-skew-slit system. The left column shows the central-slice images parallel to the trajectory. The middle and right columns show the two orthogonal central-slice images perpendicular to the trajectory.
Figure 8
Figure 8
Images reconstructed from noise-free projections. The images of the first row were reconstructed from skew-slit noise-free projections by the Novikov-type algorithm in Huang and Zeng (2006), and the images of the second row were reconstructed from the multi-skew-slit noise-free projection by the Novikov-type algorithm. The images of the first column are the z = 0 slice, the images of the second column and the third column are the x = 0 and y = 0 slices, respectively.
Figure 9
Figure 9
Images reconstructed from noisy skew-slit projections. The images in the first row were reconstructed by the Novikov-type algorithm in Huang and Zeng (2006) from skew-slit noisy projections, and the images in the second row were reconstructed by the proposed algorithm from the same skew-slit noisy projections. The images of the first column are the z = 0 slice, the images of the second column and the third column are the x = 0 and y = 0 slices, respectively. The white circles show the sampled region for standard deviation calculation.
Figure 10
Figure 10
Images reconstructed from noisy multi-skew-slit projections. The images in the first row were reconstructed by the Novikov-type algorithm in Huang and Zeng (2006) from multi-skew-slit noisy projections, and the images in the second row were reconstructed by the proposed algorithm from the same multi-skew-slit noisy projections. The images of the first column are the z = 0 slice, the images of the second column and the third column are the x = 0 and y = 0 slices, respectively. The white circles show the sampled region for standard deviation calculation.

Similar articles

Cited by

References

    1. Beekman FJ, Vastenhouw B. Design and simulation of a high-resolution stationary SPECT system for small animals. Phys. Med. Biol. 2004;49:4579–4592. - PubMed
    1. Beekman FJ, van der Have F, Vastenhouw B, van der Linden AJA, van Rijk PP, Burbach JPH, Smidt MP. U-SPECT-I: a novel nystem for submillimeter-resolution tomography with radiolabeled molecules in mice. J. Nucl. Med. 2005;46:1194–1200. - PubMed
    1. Bellini S, Piacenti M, Caffario C, Rocca F. Compensation of tissue absorption in emission tomography. IEEE Trans. Acoust. Speech Signal Process. 1979;27:213–218.
    1. Cao Z, Bal G, Accorsi R, Acton PD. Optimal number of pinholes in multi-pinhole SPECT for mouse brain imaging—a simulation study. Phys. Med. Biol. 2005;50:4609–4624. - PubMed
    1. Clough AV, Barrett HH. Attenuated Radon and Abel transforms. J. Opt. Soc. Am. 1983;73:1590–1595.

MeSH terms