. 2006 Dec;116(12):3160-70.
doi: 10.1172/JCI28996. Epub 2006 Nov 16.

Indoleamine 2,3-dioxygenase-expressing dendritic cells form suppurative granulomas following Listeria monocytogenes infection

Affiliations

Indoleamine 2,3-dioxygenase-expressing dendritic cells form suppurative granulomas following Listeria monocytogenes infection

Alexey Popov et al. J Clin Invest. 2006 Dec.

Abstract

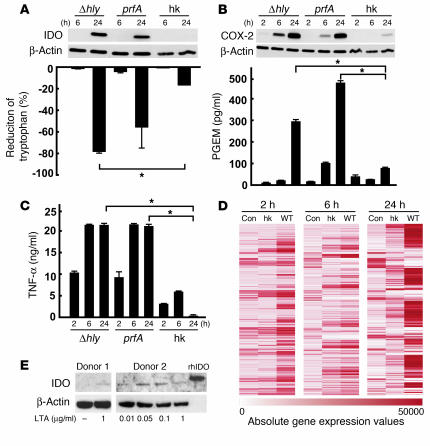
Control of pathogens by formation of abscesses and granulomas is a major strategy of the innate immune system, especially when effector mechanisms of adaptive immunity are insufficient. We show in human listeriosis that DCs expressing indoleamine 2,3-dioxygenase (IDO), together with macrophages, are major cellular components of suppurative granulomas in vivo. Induction of IDO by DCs is a cell-autonomous response to Listeria monocytogenes infection and was also observed in other granulomatous infections with intracellular bacteria, such as Bartonella henselae. Reporting on our use of the clinically applied anti-TNF-alpha antibody infliximab, we further demonstrate in vitro that IDO induction is TNF-alpha dependent. Repression of IDO therefore might result in exacerbation of granulomatous diseases observed during anti-TNF-alpha therapy. These findings place IDO(+) DCs not only at the intersection of innate and adaptive immunity but also at the forefront of bacterial containment in granulomatous infections.


Figures

Figure 1
Figure 1. Human DCs in L. monocytogenes infection.
(A) Histomorphology of lymph node sections from a patient with suppurative granulomatous listeriosis. H&E staining of a sample slide with prominent ring-wall formation of histiocytoid cells around suppurative granulomas in listeriosis. Magnification, ×100 and ×400 (H&E panels). Photographs of immunohistochemical staining with CD20, CD3, CD15, CD68, S100, CD11c, and IDO are shown. Magnification, ×250. One out of 3 comparable cases is depicted here. (B) Immunofluorescence of the same patient samples described above. S100 and CD68 were combined to distinguish between DCs and macrophages. S100 and CD11c were combined to determine a myeloid origin of the S100+ DCs. As a second marker for macrophages, double staining with CD68 and CD11c was performed. To assess expression of IDO by myeloid cells, DCs, and macrophages, analysis of IDO was combined with S100, CD11c, or CD68. One out of 3 cases is presented. Magnification, ×250. In each lower-left corner, an enlarged section of the photo is shown for more detail (magnification, ×2500). (C) Confocal microscopy (Olympus FluoView FV1000 Confocal Microscope) clearly confirms the colocalization of IDO with S100 and CD68. Magnification, ×2500.
Figure 2
Figure 2. Overall transcriptional changes in human DCs infected with L. monocytogenes.
(A) Unsupervised hierarchical clustering analysis of immDCs infected with L. monocytogenes (L.m.) for 2 hours or 6 hours or control (Con) mock-infected DCs, cultured at the same conditions for 2 hours or 6 hours. Affymetrix raw data were normalized using dChip, and a list of 1189 genes with high variability across the data set (0.5 < SD/mean < 10) was used for hierarchical clustering in dChip. (B) Visualization using GeneSpring software of the most significantly changed genes after infection with L. monocytogenes. A total of 902 transcripts were defined with dChip as significantly changed at either time point; filtering criteria are described in detail in Methods. These significantly changed genes were ordered according to the temporal pattern of expression changes. Immediate-response genes are defined as being either up- or downregulated at the 2-hour time point but not at the 6-hour time point. Immediate-early response genes are characterized by upregulated or downregulated genes at both time points, and early response genes are regulated only at 6 hours. Expression values were normalized and color coded with upregulated genes in red and downregulated genes in blue. Each colored curve represents an expression pattern of a single gene; each vertical line represents 1 sample as indicated at the bottom of the figure. Detailed gene information is provided in Supplemental Table 2.
Figure 3
Figure 3. IDO is expressed on transcriptional and functional levels in human DCs infected with L. monocytogenes.
(A) Time kinetic of IDO mRNA expression was assessed by quantitative real-time PCR. Expression of β-2 microglobulin (B2M) was used as a housekeeping gene control. Shown here are IDO expression profiles (normalized to B2M expression) in DC cultures derived from 3 different donors. Samples after L. monocytogenes infection are represented by filled symbols, the corresponding control samples by open symbols. (B) Protein expression of IDO and β-actin was assessed by immunoblotting after L. monocytogenes infection. Results of 1 representative experiment out of 6 are shown. rhIDO was used as a positive control. (C) Tryptophan depletion by enzymatically active IDO in cell supernatants was assessed by reverse-phase HPLC. Shown here is the reduction of tryptophan after 6, 12, or 24 hours in DC culture supernatants relative to tryptophan concentrations measured in DC medium alone. Mean ± SD of 3 independent experiments is shown. Asterisks highlight statistically significant comparisons (*P < 0.05, **P < 0.00001). (D) Kynurenine accumulation at the same time points was assessed using a photometric assay. Shown here are mean ± SD of 3 independent experiments. Asterisks highlight statistically significant comparison (***P < 0.01). (E) Macrophages (Mf) and DCs were differentiated from monocytes and infected with wild-type L. monocytogenes. After 24 hours, IDO protein expression was assessed by immunoblotting and analyzed quantitatively respective to β-actin expression. Representative Western blot and mean ± SD of 3 independent experiments are shown. Asterisks highlight statistically significant comparison (***P < 0.01).
Figure 4
Figure 4. Regulation of genes and proteins shown to be associated with induction of IDO.
(A) Heat map showing fold changes of gene transcription for type I and II IFNs, TNF-α, and PTGS2 (COX-2) as well as the corresponding receptors. Fold changes were calculated for each individual sample pair (control DCs versus infected DCs from a matching donor at the respective time point) and color coded (blue, downregulated; white, unchanged; and red, upregulated genes); scale of fold changes ranged from –5.19 FC to +136.48 FC (Supplemental Table 3). (B) Protein expression of TNF-α in supernatants from immDCs either infected with L. monocytogenes (+) or not infected (–) and subsequently cultured for up to 24 hours. Expression of TNF-α was assessed by ELISA. Shown here are mean ± SD derived from 4 different donors. Asterisks highlight statistically significant comparisons (*P < 0.05; **P < 0.01). (C) At the same time points as in B, DCs were harvested and subsequently lysed to assess protein expression of COX-2 and β-actin by immunoblotting. Results of 1 representative experiment out of 6 are shown. (D) To assess the function of COX-2 in DCs infected with L. monocytogenes (+) or control DCs (–), stable PGE metabolites (PGEM) were measured in DC supernatants by EIA at the indicated time points (n = 2). Asterisks highlight statistically significant comparisons (**P < 0.01). (E) Expression of IFN-γ was assessed by ELISA. Shown here are mean ± SD derived from 4 different donors. Asterisks highlight statistically significant comparisons (*P < 0.05).
Figure 5
Figure 5. Neutralization of TNF-α or IFN-γ during L. monocytogenes infection downregulates IDO expression and enzymatic activity.
immDCs were infected for 30 minutes at MOI 5, washed, and subsequently cultured for 24 hours in the absence or presence of neutralizing TNF-α antibody (infliximab, 0.1–10 μg/ml), anti–IFN-γ antibody (1 μg/ml), anti–IFN-β (1 μg/ml) or COX-2 inhibitor (rofecoxib, 1 μM). (A) IDO mRNA expression was assessed by quantitative real-time PCR. B2M was used as a housekeeping gene control; IDO expression of differentially treated DCs was normalized to the expression of infected, untreated DCs derived from the same donor. Mean ± SD of at least 3 experiments per condition are shown. Asterisks highlight statistically significant comparisons (*P < 0.05, **P < 0.005, ***P < 0.0005). (B) Protein expression of IDO was assessed by immunoblotting; rhIDO was used as a positive control. Data shown are derived from 1 representative experiment out of 3. (C) Kynurenine accumulation in the same cultures was assessed using a photometric assay. Shown here are mean ± SD of at least 3 independent experiments. Legend underneath C also applies to A and B. Asterisks highlight statistically significant comparisons (*P < 0.05, #P < 0.01). Detection of IFN-γ (D) and TNF-α (E) in supernatants from the same cultures described above. Shown here are mean ± SD derived from at least 2 donors. Asterisks highlight statistically significant comparisons (*P < 0.05, ##P < 0.0001).
Figure 6
Figure 6. Influence of L. monocytogenes virulence factors on IDO induction.
immDCs were either infected with the listeria mutants Δhly or prfA or incubated with hk L. monocytogenes for 30 minutes, washed, and subsequently cultured for 2, 6, or 24 hours Alternatively, DCs were treated with purified LTA derived from L. monocytogenes and cultured for 72 hours. Cells and supernatants were then harvested to assess (A) IDO protein expression and tryptophan levels, (B) COX-2 protein expression and PGE metabolite levels, and (C) TNF-α concentration. Mean ± SD from 2 experiments are shown. Asterisk highlights statistically significant comparison (*P < 0.05). Immunoblots are representative of 2 independent experiments. (D) A heat map illustrating the kinetics of gene expression in immDCs treated with hk L. monocytogenes or infected with virulent L. monocytogenes (WT) and corresponding mock-infected controls on a Sentrix Human-6 Expression BeadChip array. Examination of genes showing significant differences in expression levels between control and listeria-infected DCs at 1 of the 3 time points (fold change > 2; absolute difference in signal intensity > 100) yielded 1,444 candidate genes. Absolute expression values of these gene transcripts in all 3 cell subsets were color coded (white, low expression; dark red; high expression); scale of expression values ranged from 0 to 50,000. (E) IDO protein expression in human DCs was assessed by immunoblotting after 72 hours of LTA treatment at indicated concentrations; β-actin was used as loading control and rhIDO as a positive control. Results of 2 representative experiments are shown.

References

    1. Kaufmann S.H. Immunity to intracellular bacteria. Annu. Rev. Immunol. 1993;11:129–163. - PubMed
    1. Gordon S. Alternative activation of macrophages. Nat. Rev. Immunol. 2003;3:23–35. - PubMed
    1. Pamer E.G. Immune responses to Listeria monocytogenes. Nat. Rev. Immunol. 2004;4:812–823. - PubMed
    1. Unanue E.R. Studies in listeriosis show the strong symbiosis between the innate cellular system and the T-cell response. Immunol. Rev. 1997;158:11–25. - PubMed
    1. Portnoy D.A., Auerbuch V., Glomski I.J. The cell biology of Listeria monocytogenes infection: the intersection of bacterial pathogenesis and cell-mediated immunity. J. Cell Biol. 2002;158:409–414. - PMC - PubMed

Publication types

MeSH terms