. 2006 Nov 17;2(11):e154.
doi: 10.1371/journal.pcbi.0020154. Epub 2006 Oct 5.

Optimal noise filtering in the chemotactic response of Escherichia coli

Affiliations

Optimal noise filtering in the chemotactic response of Escherichia coli

Burton W Andrews et al. PLoS Comput Biol. .

Abstract

Information-carrying signals in the real world are often obscured by noise. A challenge for any system is to filter the signal from the corrupting noise. This task is particularly acute for the signal transduction network that mediates bacterial chemotaxis, because the signals are subtle, the noise arising from stochastic fluctuations is substantial, and the system is effectively acting as a differentiator which amplifies noise. Here, we investigated the filtering properties of this biological system. Through simulation, we first show that the cutoff frequency has a dramatic effect on the chemotactic efficiency of the cell. Then, using a mathematical model to describe the signal, noise, and system, we formulated and solved an optimal filtering problem to determine the cutoff frequency that bests separates the low-frequency signal from the high-frequency noise. There was good agreement between the theory, simulations, and published experimental data. Finally, we propose that an elegant implementation of the optimal filter in combination with a differentiator can be achieved via an integral control system. This paper furnishes a simple quantitative framework for interpreting many of the key notions about bacterial chemotaxis, and, more generally, it highlights the constraints on biological systems imposed by noise.


Conflict of interest statement

Competing interests. The authors have declared that no competing interests exist.

Figures

Figure 1
Figure 1. Bacterial Chemotaxis
(A) E. coli swim towards nutrients via alternating running and tumbling movements. During each running period, the cell is aligned with the chemoattractant gradient with angle θi. These angles change abruptly after each tumble. However, rotational diffusion hinders the ability to swim in straight paths, so that the alignment angle varies stochastically. (B) Chemotactic system. Chemoreceptor complexes contain the proteins CheA and CheW. Ligand–receptor interactions, stochastic in nature, affect the autophosphorylation of the kinase CheA (A), which is capable of transferring its phosphoryl group (P) to the protein CheY (Y). The phosphorylated form of CheY induces clockwise rotation of the flagella, causing tumbling. CheA also transfers phosphoryl groups to CheB (B), an enzyme responsible for demethylation of the receptor complex. Adaptation is achieved via the methylation of the receptor complex by CheR (R). Clockwise rotation of the flagella induces tumbling and a reorientation of the cell while CCW rotation propels the cell forward in a run. Swimming, affected by rotational and translational diffusion, leads the cell to new ligand concentrations in the environment.
Figure 2
Figure 2. Effect of Adaptation Time on Filtering Capabilities
(A) When subjected to an abrupt change in chemoattractant concentration (x(t)), the output (A(t)) of the model of the E. coli signaling pathway (Materials and Methods) responds with an initial transient burst which decays exponentially. The adaptation time depends on the component levels of the signaling pathway such as the methylation rate γR [13,14]. Faster methylation rates (γR) yield shorter adaptation times but result in noisier activity levels. Thus, the filtering capabilities of E. coli are determined by the time it takes to adapt to step inputs of ligand. (B) The adaptation response of E. coli is representative of a system consisting of a low-pass filter (k/(s + k)) coupled with a differentiator (s) (inset). A negative gain is used here to mimic the activity response of E. coli to positive changes in ligand [38]. As in the case of the E. coli model, the output of the low-pass filter plus differentiator (y(t)) is a filtered version of the derivative of the input signal. Smaller filter cutoff frequencies (smaller k), which correspond to longer averaging times, yield less noisy outputs. Red dashed lines indicate the time it takes the mean output of the filter to reach 95% of its steady state level. Although longer averaging times help reduce noise, they result in a slower response: the output takes longer to approach zero after the step.
Figure 3
Figure 3. Effect of Adaptation Time on Chemotactic Efficiency
Chemotaxis was simulated by assuming that the signaling pathway was approximated by the system of Figure 2B. (A) Different choices of k, and hence different adaptation times, result in varying chemotaxis efficiency. For example, cells with cutoff frequencies of k = 0.04 rad/s and k = 14 rad/s moved approximately 90 μm and 70 μm along the chemoattractant gradient. In contrast, a cell with a cutoff frequency of 3.4 rad/s moved approximately 250 μm along the gradient. (B) These simulations were repeated for a large range of cutoff frequencies. The resulting frequency-dependent chemotactic performance was fitted with a Rayleigh function to estimate the optimal cutoff frequency for chemotaxis (red dashed line). Chemotactic performance was based on the final position along the gradient after 80 s. Each point represents the average of 500 simulation runs, and vertical bars indicate mean plus or minus standard error of the mean. Rotational and translational diffusion coefficients of 0.16 rad2/s and 2.2 × 10⁻¹ μm2/s, respectively, were used. Nominal parameters used: u = 20 μm/s, RT = 2.5 μM, Kd = k /k + = 100 μM, L 0 = 0.01 μM, and g = 0.2 μM/ μm.
Figure 4
Figure 4. Noise and Rotational Diffusion Effects on Chemotaxis and the Optimal Filter
(A) The effect of the measurement noise on the optimal cutoff frequency for chemotactic performance was studied by varying the measurement noise (by multiplying the binding variance by a factor) by several orders of magnitude and determining, as in Figure 3B, the optimal cutoff frequency. All cases showed a biphasic response. Decreasing the binding noise level results in higher optimal chemotactic cutoff frequencies and improved chemotaxis. (B) Similarly, the effect of rotational diffusion on chemotactic performance was studied by varying the diffusion coefficient by several orders of magnitude. Decreasing rotational diffusion increases the chemotactic efficiency, but decreases the optimal cutoff frequency. (C) The optimal filter for chemoattractant estimation was computed and its frequency-dependent magnitude plotted for a specific combination of model parameters. Its shape can be approximated by a first-order filter where the cutoff frequency is the frequency at which the gain is 0.707 (−3dB point) that of the zero frequency gain. (D,E) The noise and rotational diffusion dependence of the optimal cutoff frequencies for chemotaxis obtained in A and B was compared with the optimal cutoff frequencies for chemoattractant estimation predicted by the optimal filter theory. The vertical bars indicate cutoff frequencies that yield chemotactic performances of 95%–100% of the maximum of the Rayleigh curve fitting (see Figure 3B). Simulation and optimal filter parameter values were as in Figure 3.
Figure 5
Figure 5. Environmental Factors Influence the Optimal Cutoff Frequency for Chemoattractant Estimation
The optimal filter for chemoattractant estimation was computed for a range of gradients (A) and mean concentrations (B). Nominal parameter values were as in Figure 3.
Figure 6
Figure 6. Frequency Dependence of the Signaling Response
(A) The frequency-dependent filtering responses for the optimal filter (red solid line) and experimental data (green dashed line; [20]). The experimental data, obtained as the Fourier transform of the response of cells to an impulse of chemoattractant [20] and adjusted to remove the differentiator and downstream phosphorylation cascade (Materials and Methods), also exhibits the characteristics of a low-pass filter. Parameters used for the theoretical filter shown here are L 0 = 1 μM, g = 1.5 μM/μm, and u = 20 μm/s. Also included is the frequency response of the model (blue dashed line) linearized about a ligand input of L 0 = 1 μM. The dotted black line shows a dependency of (frequency)−1. (B) The predicted optimal cutoff frequency is compared with that of the filter for a range of chemoattractant gradients and mean concentrations. The line through which both surfaces intersect represents the chemoattractant profiles for which E. coli filters out disturbances optimally with respect to the parameters used for the model. (C) Plot of the concentration gradient against mean concentration for the points where the surfaces in (B) intersect. The linear dependence suggests that E. coli is conditioned for optimal filtering in chemoattractant concentration profiles of constant relative gradient.
Figure 7
Figure 7. Optimal Filtering Cutoff Frequency Is Determined by the Signal and Noise
(A) Insight into the relevant features of the optimal estimator can be obtained by considering a simplified model that assumes the cell measures L + v, where L is the true ligand concentration. The system dL/dt = w acts as an integrator and has signal PSD dependent on the rotational diffusion coefficient (blue solid line). The observed signal L + v includes the effect of the binding noise v which is assumed to be a white noise process (blue dashed line). For this model, the optimal filter for the estimation of L, given L + v, is a first-order, low-pass filter with a cutoff frequency (ωcf) related to the covariances of w and v:formula image 
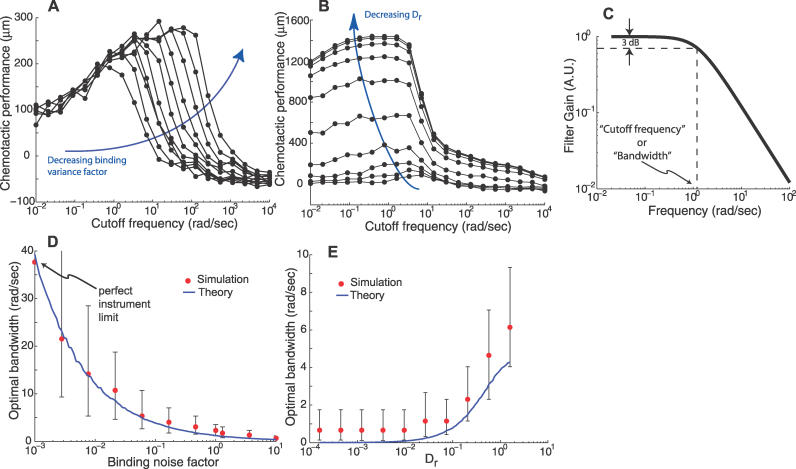
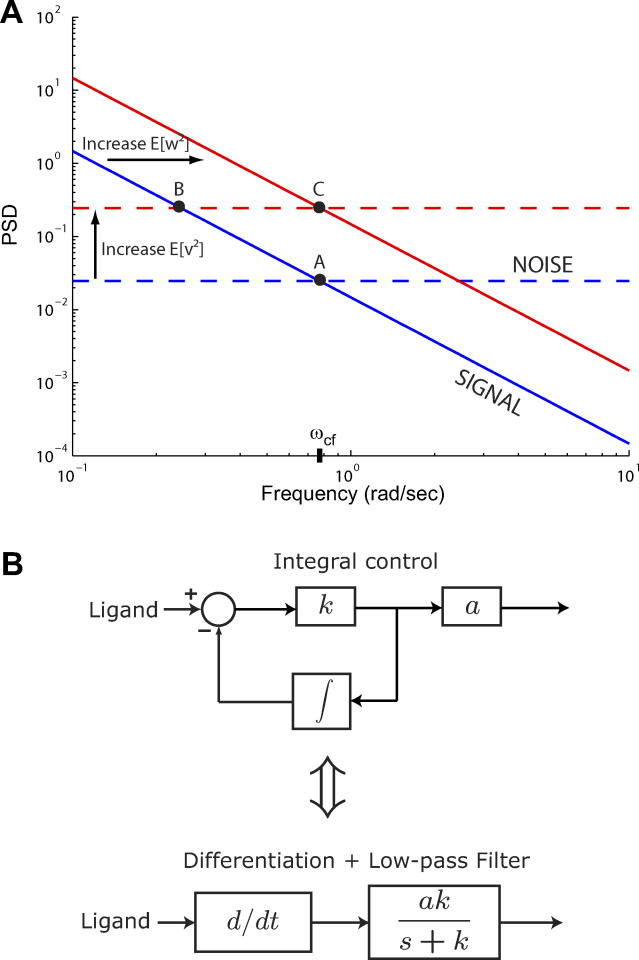
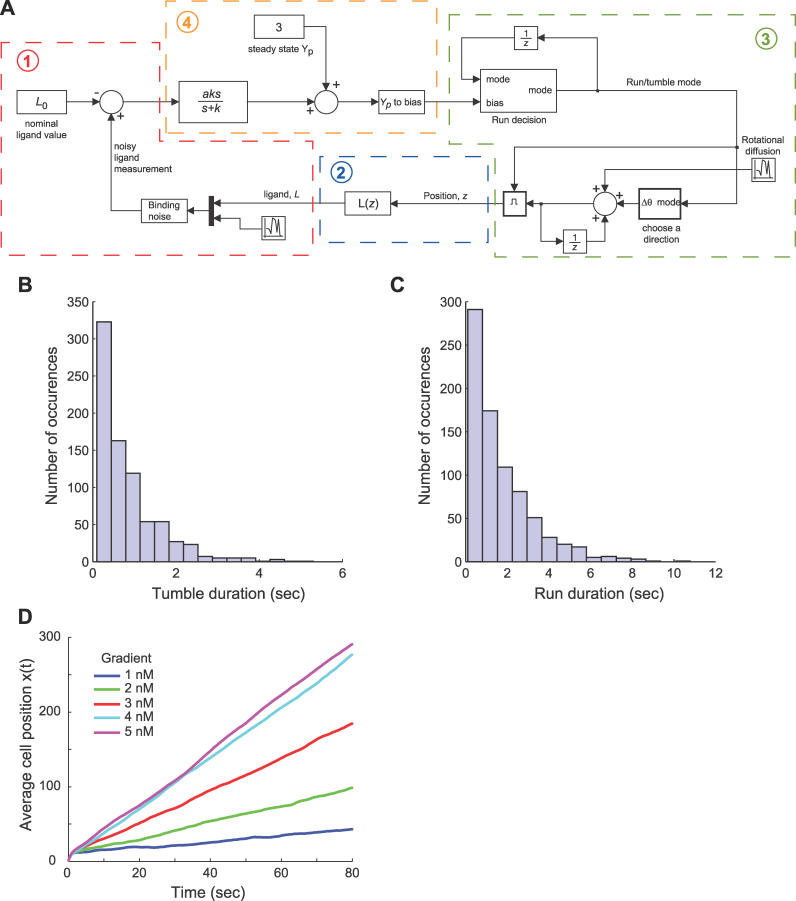
(Protocol S1). Graphically, this is determined by the intersection of the signal and noise PSDs (point A). Increasing the noise variance (red dashed line) decreases the optimal cutoff frequency because the filter must become more restrictive to eliminate the additional noise (point B). If the signal PSD is then increased (red solid line), for example, by increasing the effect of rotational diffusion, the cutoff frequency increases (point C). Parameters used for point A: u = 20 μm/s, Dr = 0.16 rad2/s, τ = 1 s, RT = 2.5 μM, k /k + = 100 μM, g = 0.03 μM/μm, and binding is assumed at steady state with a ligand value of L 
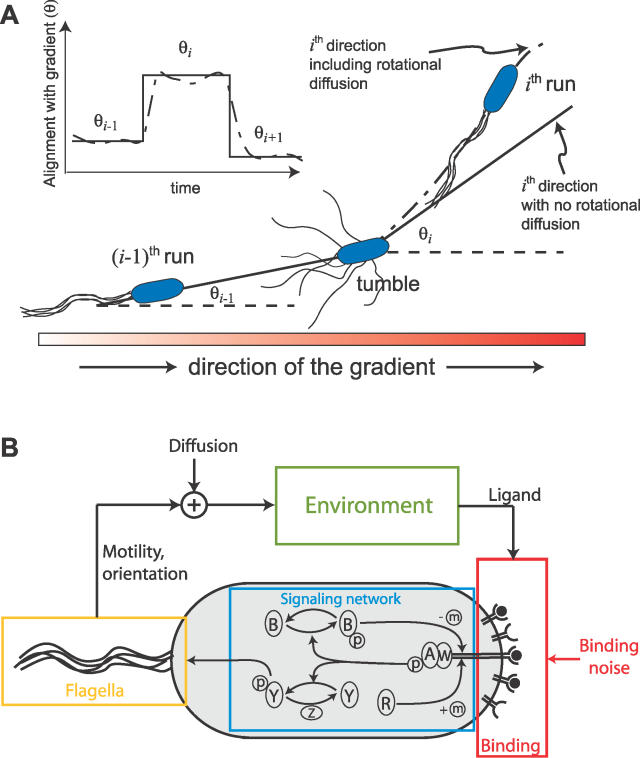
0 = 1 μM. (B) Block diagram representation of the chemotactic system. A system using an integral control feedback mechanism (top) is functionally equivalent to one consisting of the series connection of a differentiator and a first-order low-pass filter. In the chemotaxis pathway, this subsystem is followed by a conversion function of CheYp to the running bias.
Figure 8
Figure 8. Model of E. coli Signaling Network
A model of the bacterial signaling network is shown for a cluster of N receptors with M methylation sites each. The receptor cluster can exist in a ligand bound or unbound form, each with up to a total of NM sites methylated. The methylation (demethylation) rate of a particular state is proportional to the probability of the state being inactive (active).
Figure 9
Figure 9. Validation of E. coli Signaling Network Model
(A) Response of the E. coli signaling network model is plotted for a 0.1-mM step increase in chemoattractant concentration from 0.2 mM at 10 s. For comparison with experimental data, activity from the model is converted to the probability of CCW flagella rotation by means of a Hill function (Materials and Methods). A transient response after an initial increase in CCW probability adapts to the pre-stimulus level. Adaptation times are similar to experimentally obtained data [20,27] (red dashed line shows data from Figure 2 of [27]). (B) Response to a positive (+0.2 mM) chemoattractant impulse of width 0.5 s is also consistent with experimentally observed behavior [20,27] (red dots show data from Figure 1 of [27]). (C) The initial response to addition (removal) of attractant increases (decreases) with increasing change in attractant concentration. Adaptation times for attractant addition are longer than that for removal as observed [17]. (D) For step inputs, normalized peak activity of the model (1 – ΔA/Ass, where ΔA is the change in activity from steady-state level Ass) exhibits sensitivity to the size of the step (red line with dots is a guide to the eye). This sensitivity response closely matches data from the “small lattice” model of [36] (blue line with triangles is a fitted sigmoid function). The blue dashed line indicates experimental data from [27] as plotted in Figure 4 of [36] (MeAsp input concentration of [27] is adjusted to that of aspartate that yields an equivalent receptor occupancy). As discussed in [36], the nonzero baseline of our model for large step inputs is due to a fraction of receptors in the cluster always having a nonzero probability of being active. (E,F) Frequency responses of the E. coli signaling network model and the model from [17], linearized about a ligand input of L 0 = 1 μM, reveal low-pass characteristics consistent with observations in [27].
Figure 10
Figure 10. Step Response of the Linearized Signaling Network
Comparison of the step response of the E. coli signaling network model to the response of the linearized form of the model shows that the linearization is valid for even moderately large step changes in attractant. Response shown is for a step ligand change from L = 1 μM to L = 2 μM (A), 10 μM (B), 50 μM (C), and 100 μM (D), with the linearization about the ligand value L 0 = 1 μM. Model parameters are the same as in Figure 9.
Figure 11
Figure 11. Model of Bacterial Chemotaxis
(A) The chemotaxis simulation assumes the following feedback interaction between the bacteria and its environment: 1) the external environment affects the sensing model through the external ligand concentration L and incorporates the effect of binding noise; 2) ligand concentration is determined by the location of the cell in the environment (the spatial location z); 3) spatial location is determined by integrating the velocity and angle, which incorporates the effect of rotational diffusion and the “run/tumble” decisions; and 4) the run/tumble decisions are based on the signaling mechanism's response (that is, the filter + differentiation) to the measured ligand concentration. (B,C) Validation of chemotaxis model histograms of tumble (B) and run (C) durations for an unstimulated (g = L 0 = 0) E. coli with a simulation time of 2,000 s. Both distributions exhibit characteristics of a Poisson process. (D) Average simulation results of 500 runs of a bacteria swimming in a gradient of ligand concentration with varying chemoattractant slopes.

Similar articles

Cited by

References

    1. Csete ME, Doyle JC. Reverse engineering of biological complexity. Science. 2002;295:1664–1669. - PubMed
    1. Kitano H. Computational systems biology. Nature. 2002;420:206–210. - PubMed
    1. Rao CV, Wolf DM, Arkin AP. Control, exploitation and tolerance of intracellular noise. Nature. 2002;420:231–237. - PubMed
    1. Orrell D, Bolouri H. Control of internal and external noise in genetic regulatory networks. J Theor Biol. 2004;230:301–312. - PubMed
    1. Korobkova E, Emonet T, Vilar JMG, Shimizu TS, Cluzel P. From molecular noise to behavioural variability in a single bacterium. Nature. 2004;428:574–578. - PubMed

Publication types

Substances