. 2006 Nov 17;2(11):e187.
doi: 10.1371/journal.pgen.0020187.

Virulence attributes and hyphal growth of C. neoformans are quantitative traits and the MATalpha allele enhances filamentation

Affiliations

Virulence attributes and hyphal growth of C. neoformans are quantitative traits and the MATalpha allele enhances filamentation

Xiaorong Lin et al. PLoS Genet. .

Abstract

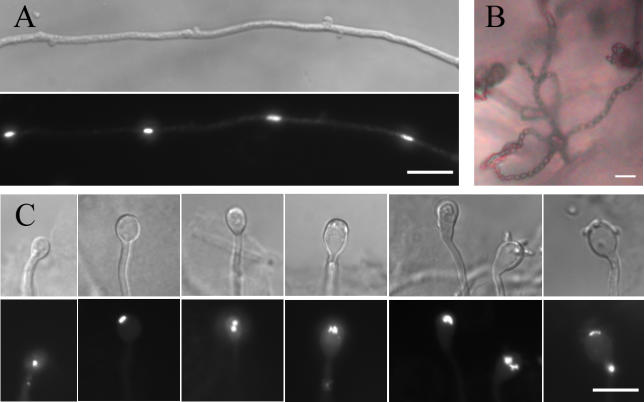
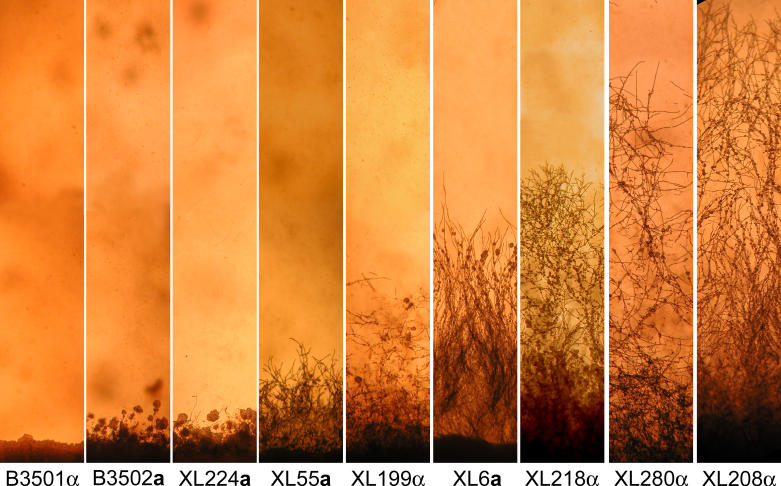
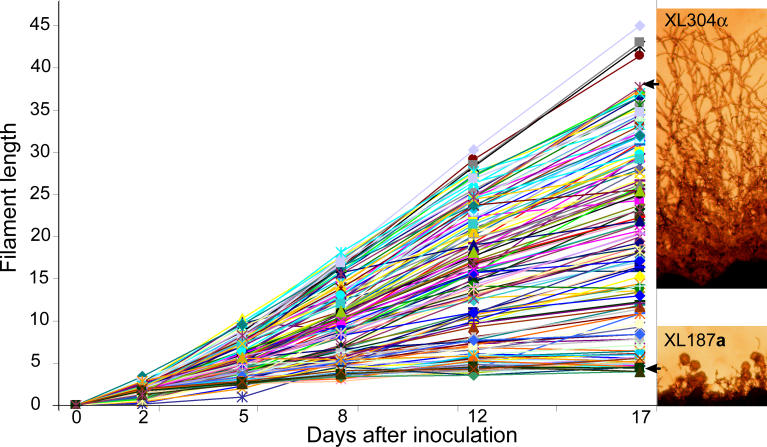
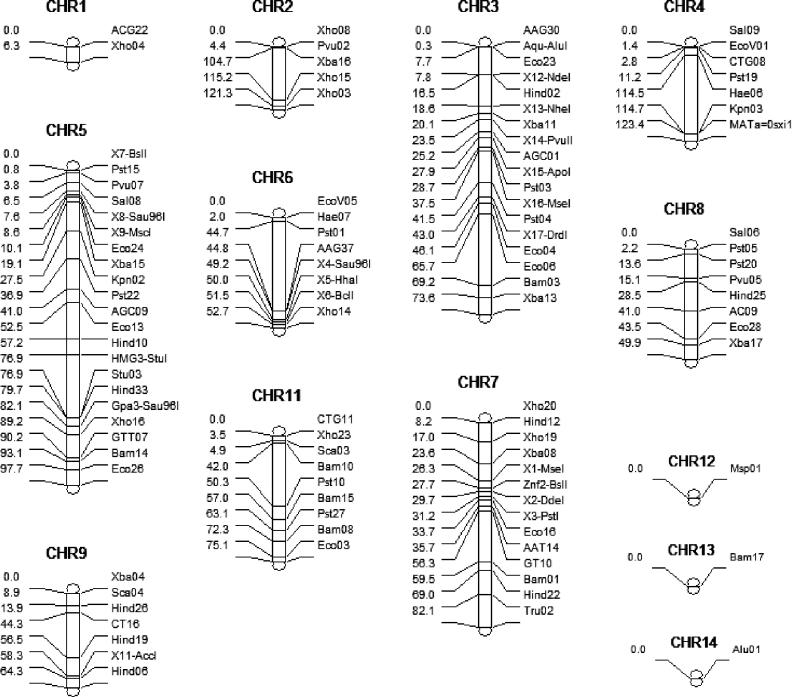
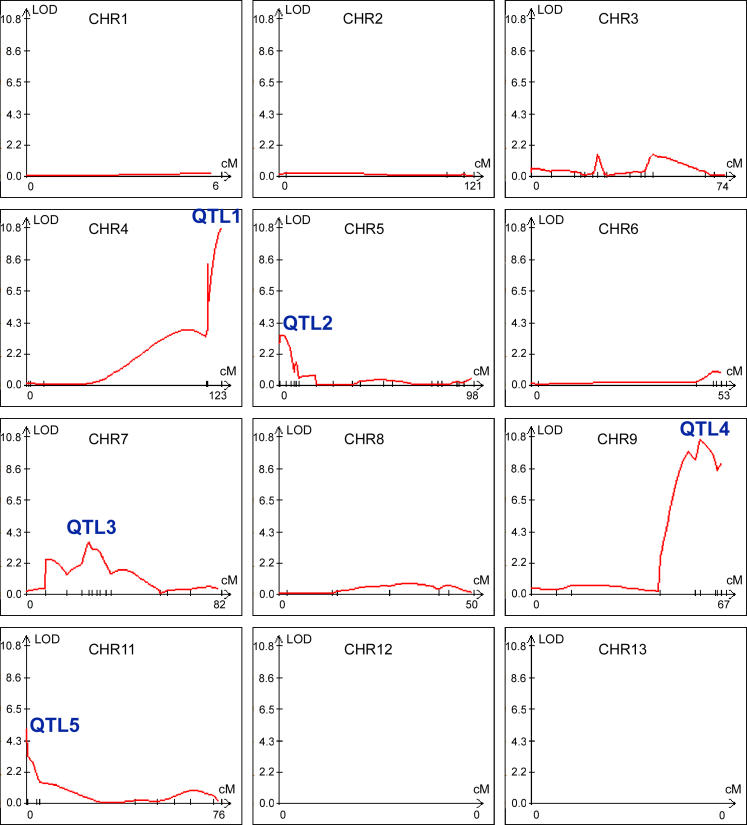
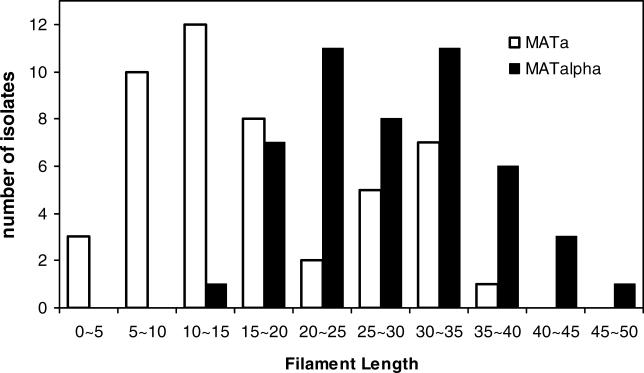
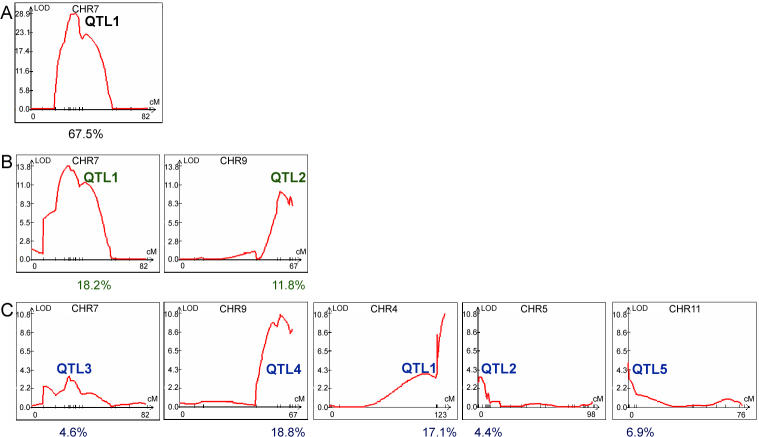
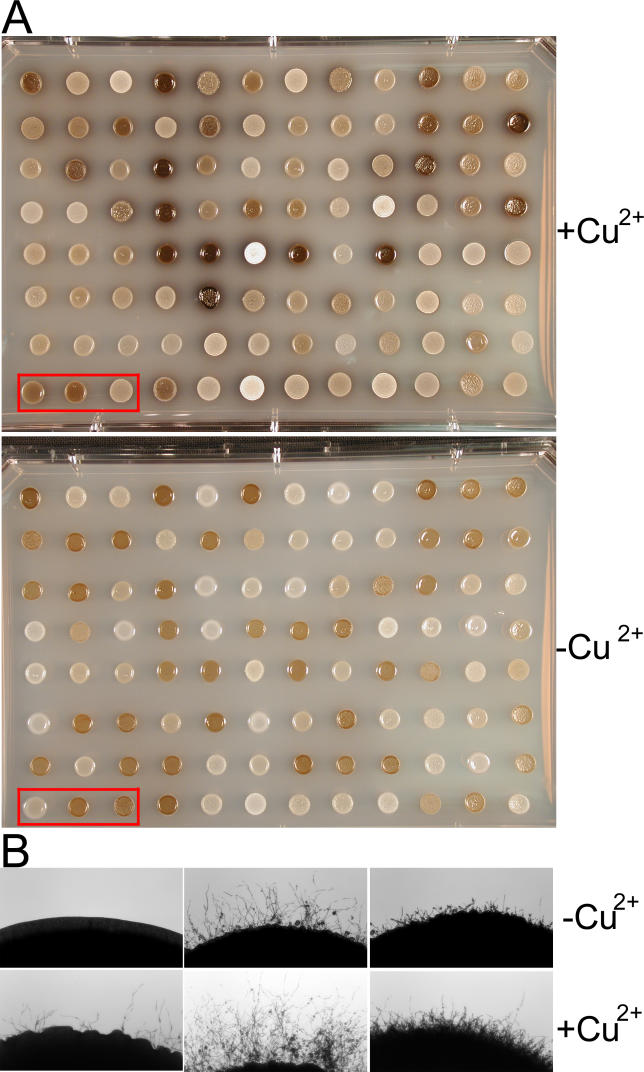
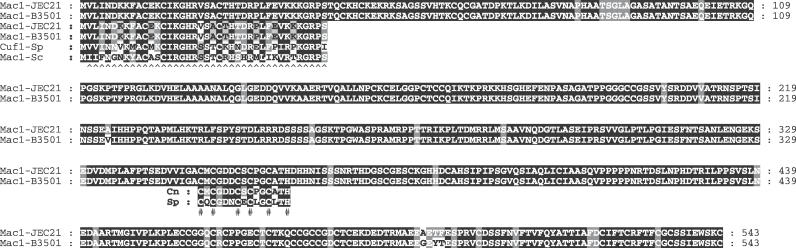
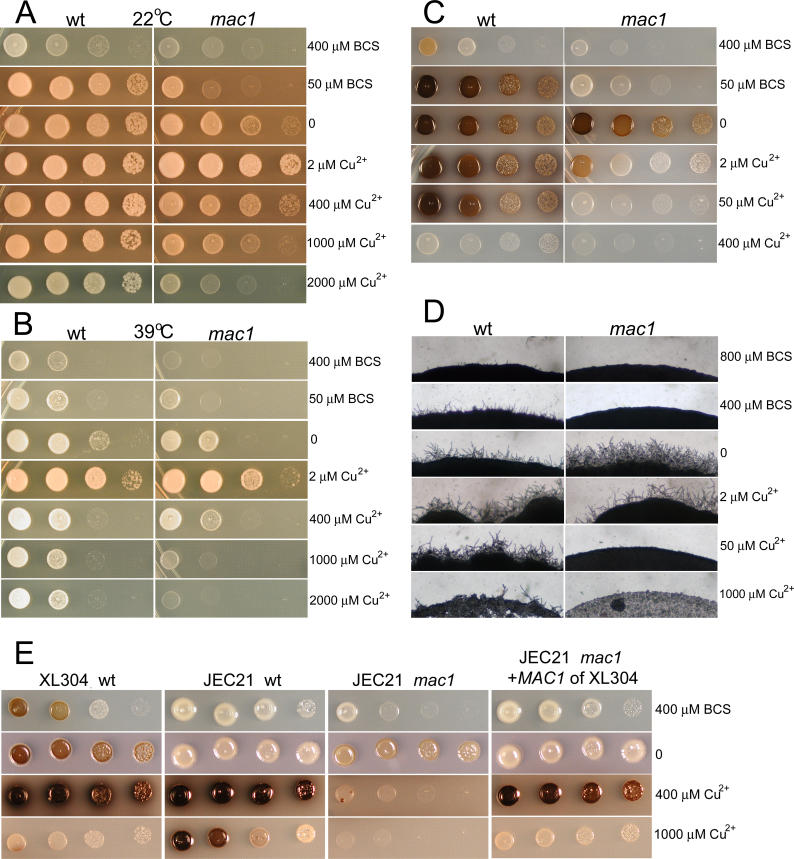
Cryptococcus neoformans is a fungal human pathogen with a bipolar mating system. It undergoes a dimorphic transition from a unicellular yeast to hyphal filamentous growth during mating and monokaryotic fruiting. The traditional sexual cycle that leads to the production of infectious basidiospores involves cells of both alpha and a mating type. Monokaryotic fruiting is a modified form of sexual reproduction that involves cells of the same mating type, most commonly alpha, which is the predominant mating type in both the environment and clinical isolates. However, some a isolates can also undergo monokaryotic fruiting. To determine whether mating type and other genetic loci contribute to the differences in fruiting observed between alpha and a cells, we applied quantitative trait loci (QTL) mapping to an inbred population of F2 progeny. We discovered that variation in hyphal length produced during fruiting is a quantitative trait resulting from the combined effects of multiple genetic loci, including the mating type (MAT) locus. Importantly, the alpha allele of the MAT locus enhanced hyphal growth compared with the a allele. Other virulence traits, including melanization and growth at 39 degrees C, also are quantitative traits that share a common QTL with hyphal growth. The Mac1 transcription factor, encoded in this common QTL, regulates copper homeostasis. MAC1 allelic differences contribute to phenotypic variation, and mac1Delta mutants exhibit defects in filamentation, melanin production, and high temperature growth. Further characterization of these QTL regions will reveal additional quantitative trait genes controlling biological processes central to fungal development and pathogenicity.


Conflict of interest statement

Competing interests. The authors have declared that no competing interests exist.

Figures

Figure 1
Figure 1. Fruiting in a and α Isolates Is Similar
The filamentous isolate B3502a was cultured on V8 medium in the presence of synthetic α pheromone at 22 °C in the dark for two wk. The filamentous edge far from the original yeast growth patch was separated, fixed, and stained with DAPI. (A) The hyphae produced are monokaryotic with unfused clamps. (B) Four long chains of basidiospores were produced during fruiting. (C) Basidia with one, two, or four nuclei at different stages of basidium development were observed. In (A) and (C), the upper panel shows the DIC images, and the lower panel shows the corresponding fluorescent images. Scale bar, 10 μm.
Figure 2
Figure 2. Variation in Filamentous Growth during Fruiting
A subset of the fruiting progeny derived from the cross between the nonfilamentous strain B3501α and the filamentous strain B3502a was examined microscopically. Cells were cultured on V8 medium for 25 d. Parental strains and several representative progeny displaying variations in hyphal growth are shown with the strain names listed below them.
Figure 3
Figure 3. Hyphal Elongation Is a Quantitative Trait
(Right panels) Parental strains XL304α and XL187a show phenotypic extremes in hyphal growth. Cells were cultured on V8 medium for 15 d. (Left panel) Hyphal length of the progeny shows a continuous trend varying from those that produce hyphae as short as the parental strain XL187a or hyphae as long as the parental strain XL304α. Cells were grown on V8 medium and hyphal length was measured at the indicated time from images captured by photo-microscopy.
Figure 4
Figure 4. Marker Distribution on Each Chromosome
The distance between markers is proportional to the scale and is based on genetic distance calculated from physical distance (see Materials and Methods). The chromosome number is indicated at the top, the marker name is indicated on the right side for each chromosome, and the relative genetic position of each marker is indicated on the left side. The map was generated by WinQTL.
Figure 5
Figure 5. Five Significant QTLs Influence the Variation of Hyphal Elongation
Analysis by WinQTL using the CIM method is shown. The y-axis shows the LOD score and the x-axis shows the marker location on each chromosome. Five QTLs with a LOD score greater than the threshold 3.2 are labeled. Chromosome 14 is not depicted, as no QTL was identified on this chromosome.
Figure 6
Figure 6. The α Allele of the MAT Locus Is Associated with Enhanced Hyphal Growth
The number of α or a isolates was plotted against the trait value of hyphal elongation to analyze the marker-trait association. Isolates possessing the a allele are depicted as open bars and isolates possessing the α allele are depicted as solid bars.
Figure 7
Figure 7. Expression Profile of Genes in the MAT Locus Is Similar between a and α
RNA from strain XL304α and XL187a cultured on V8 medium for 24 h was hybridized against each other on a 70-mer genome array after labeling with fluorescent dyes. The expression level was normalized across the genome, and the average of three independent replicates for the genes in the MAT locus that are on the array is shown. The a alleles are indicated as open bars and the α alleles as solid bars. Because of the high conservation between the a and α alleles for the ETF1 and MYO2 genes, instead of separate expression levels for each allele, the expression ratio of the two alleles is used and indicated as hatched bars. Because the ratio of ETF1 and MYO2 is close to 1, it indicates that the two are expressed at equivalent levels in the two cell types.
Figure 8
Figure 8. Two Virulence Traits, Melanin Production and High Temperature Growth, Are Quantitative Traits
The inbred population generated from strains XL304α and XL187a exhibited phenotypic variation in both melanin production (top) and growth at 39 °C (bottom). An equal number of cells were incubated on L-DOPA medium at 22 °C for 4 d (top) and on YPD medium at 39 °C for 4 d (bottom). The numbers above the first row indicate the score assigned to the corresponding progeny in the first row. α and a indicate the parental strains XL304α and XL187a.
Figure 9
Figure 9. Application of QTL Mapping to Melanin Production and Growth at 39 °C
The averaged scores obtained from three independent replicates for melanin production and growth at 39 °C were used as trait values and applied in the WinQTL program. Profiles obtained by CIM are shown. One QTL on Chromosome 7 was identified as responsible for variation in melanin production (A) and two QTLs on Chromosomes 7 and 9 as responsible for growth sensitivity to 39 °C were identified consistently by single marker analysis, IM, CIM, and MIM (B). Other chromosomes without any significant QTL are not shown. Five QTLs responsible for variation of hyphal growth located on Chromosomes 7, 9, 4, 5, and 11 are also shown for comparison (C). The numbers below indicate the percentage of variation accounted for by the corresponding QTLs above according to CIM analyses. LOD threshold for melanin, temperature sensitivity, and filamentation was 7.1, 3.3, and 3.2 respectively.
Figure 10
Figure 10. Different Responses to Copper in Melanin Production and Filamentation among the Mapping Population
Cells were cultured on L-DOPA medium with or without addition of 50 μM copper sulfate. (A) Differences in melanin production. The upper panel shows the melanin production on medium supplemented with copper and the lower panel without copper addition. (B) Differences in filamentation. The progeny in the left bottom corner of the plate in red rectangles in (A) are shown. The upper panel shows filamentation in the medium without copper and the lower panel with copper addition.
Figure 11
Figure 11. The C. neoformans Mac1 Protein Is Polymorphic
Translated amino acid sequences for Mac1 from strains B3501α and JEC21α (congenic to B3502a) are depicted. CNG02270 contains a copper-fist DNA binding domain at the N-terminus that is conserved between copper-regulating transcription factors, such as Mac1 of S. cerevisiae and Cuf1 of S. pombe. It also shares a copper-binding motif at the C-terminal region with S. pombe Cuf1 (328–342aa) that is important for activity. ^, sequences underlined with this mark are the predicted copper-Fist DNA binding domain. #, cysteine and histidine residues conserved between Cuf1 of S. pombe and Mac1 of C. neoformans. Cn, C. neoformans; Sc, S. cerevisiae; Sp, S. pombe.
Figure 12
Figure 12. Mac1 Is a QTG Regulating Growth, Melanization, and Filamentation of C. neoformans
Wild-type strain XL304α and its mac1 mutant were cultured on YPD medium with the indicated concentrations of BCS or copper sulfate at 22 °C (A) and 39 °C (B). The mac1 mutant showed hypersensitivity under copper-limiting and copper-rich conditions at both temperatures. Wild-type and the mac1 mutant were cultured on L-DOPA medium with the indicated concentrations of BCS or copper sulfate at 22 °C for induction of melanin production (C). The melanin production in mac1 mutant is also hypersensitive to copper in the medium, showing a bell-shaped response similar to growth (C). Wild-type and the mac1 mutant were cultured on V8 medium (pH 7.0) with the indicated concentrations of BCS or copper sulfate at 22 °C for induction of filamentation (D). Filamentation of the mac1 mutant is highly sensitive to copper ions in the medium (D). MAC1 allele exchange indicates different functions of the two alleles (E). Wild-type XL304α, wild-type JEC21α, JEC21α mac1 mutant, and transgenic JEC21α mac1 mutant with the MAC1 XL304α allele were cultured on L-DOPA medium at 22 °C with the indicated concentrations of BCS or copper sulfate (E).

Similar articles

Cited by

References

    1. Casadevall A, Perfect JR. Cryptococcus neoformans. Washington (D.C.): ASM Press; 1998. 541
    1. Bailly MP, Boibieux A, Biron F, Durieu I, Piens MA, et al. Persistence of Cryptococcus neoformans in the prostate: Failure of fluconazole despite high doses. J Infect Dis. 1991;164:435–436. - PubMed
    1. Barber BA, Crotty JM, Washburn RG, Pegram PS. Cryptococcus neoformans myositis in a patient with AIDS. Clin Infect Dis. 1995;21:1510–1511. - PubMed
    1. Sobel JD, Vazquez JA. Fungal infections of the urinary tract. World J Urol. 1999;17:410–414. - PubMed
    1. Sorrell TC, Chen SC, Ruma P, Meyer W, Pfeiffer TJ, et al. Concordance of clinical and environmental isolates of Cryptococcus neoformans var. gattii by random amplification of polymorphic DNA analysis and PCR fingerprinting. J Clin Microbiol. 1996;34:1253–1260. - PMC - PubMed

Publication types

MeSH terms