

Novel tumor antigens elicit anti-tumor humoral immune reactions in a subset of patients with polycythemia vera
- PMID: 17113348
- PMCID: PMC2637448
- DOI: 10.1016/j.clim.2006.10.006
Novel tumor antigens elicit anti-tumor humoral immune reactions in a subset of patients with polycythemia vera
Abstract
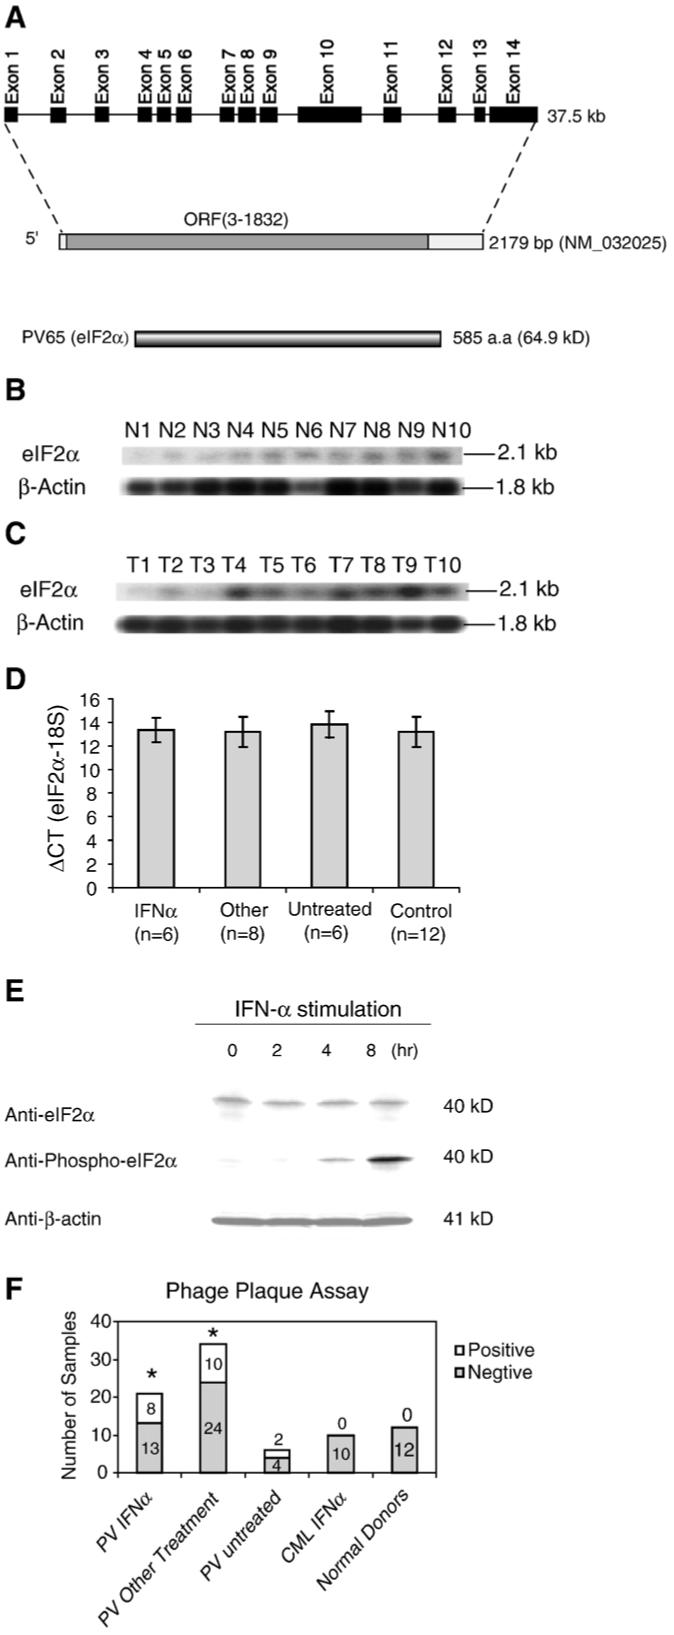
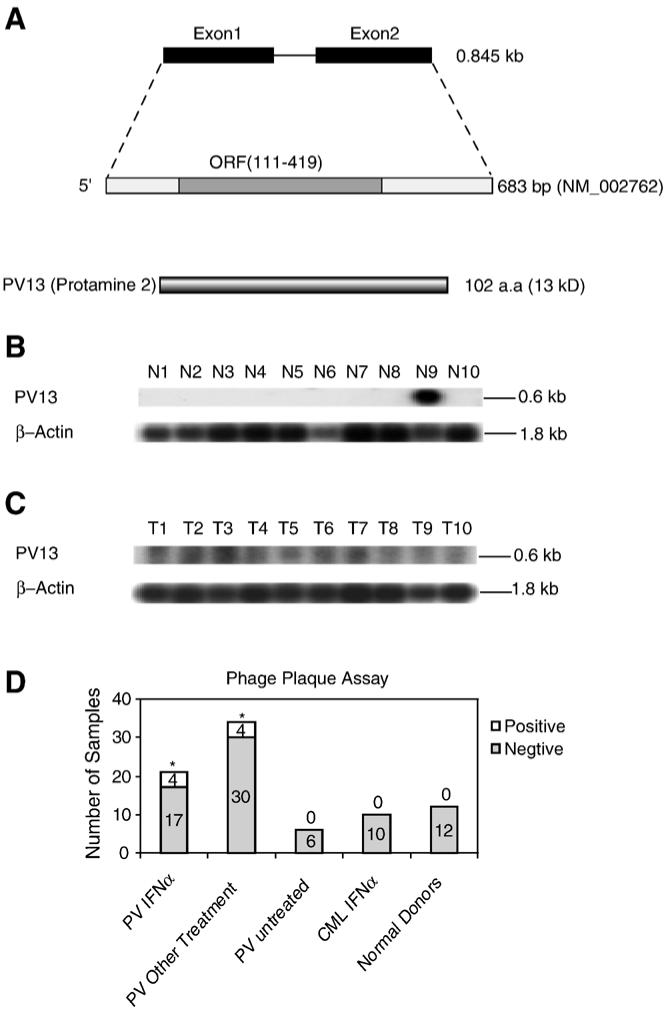
We attempted to determine whether the immune reactions elicited by aberrantly expressed testis antigens contribute to the beneficial responses to interferon (IFN)-alpha therapy and other therapies in patients with polycythemia vera (PV). We screened a human testis cDNA library using SEREX (serological analysis of tumor antigens by screening an expression cDNA library with sera from three patients with PV who had undergone IFN-alpha-induced or other therapeutics-induced remission). We identified two novel PV associated tumor antigens, PV65 (eIF-2alpha) and PV13 (protamine 2). These 2 antigens elicited IgG antibody reactions in a subset of PV patients but not in healthy donors, suggesting that they are authentic tumor antigens. Increased phosphorylation of PV65 in response to stimulation of IFN-alpha, and upregulation of PV13 in tumor cells might enhance their abilities in elicitation of immune reactions in patients. These findings provide new insights into the mechanism underlying the regulation of the self-antigen repertoire in eliciting anti-tumor immune reactions in patients with polycythemia vera, and suggest their potential as the targets of novel immunotherapy.
Figures
Similar articles
-
A novel unconventional antigen MPD5 elicits anti-tumor humoral immune responses in a subset of patients with polycythemia vera.Int J Immunopathol Pharmacol. 2007 Apr-Jun;20(2):373-80. doi: 10.1177/039463200702000218. Int J Immunopathol Pharmacol. 2007. PMID: 17624250 Free PMC article.
-
An unconventional antigen translated by a novel internal ribosome entry site elicits antitumor humoral immune reactions.J Immunol. 2006 Oct 1;177(7):4907-16. doi: 10.4049/jimmunol.177.7.4907. J Immunol. 2006. PMID: 16982933 Free PMC article.
-
Humoral immune responses to testis antigens in sera from patients with prostate cancer.Cancer Immun. 2006 Jan 10;6:1. Cancer Immun. 2006. PMID: 16401063
-
Novel and combination therapies for polycythemia vera and essential thrombocythemia: the dawn of a new era.Expert Rev Hematol. 2020 Nov;13(11):1189-1199. doi: 10.1080/17474086.2020.1839887. Epub 2020 Nov 1. Expert Rev Hematol. 2020. PMID: 33076714 Free PMC article. Review.
-
Novel and emerging therapies for the treatment of polycythemia vera.Expert Rev Hematol. 2015 Feb;8(1):101-13. doi: 10.1586/17474086.2015.972359. Epub 2014 Oct 29. Expert Rev Hematol. 2015. PMID: 25353086 Free PMC article. Review.
Cited by
-
Cigarette Smoke and Morphine Promote Treg Plasticity to Th17 via Enhancing Trained Immunity.Cells. 2022 Sep 8;11(18):2810. doi: 10.3390/cells11182810. Cells. 2022. PMID: 36139385 Free PMC article.
-
Interferon-alpha targets JAK2V617F-positive hematopoietic progenitor cells and acts through the p38 MAPK pathway.Exp Hematol. 2010 Jun;38(6):472-80. doi: 10.1016/j.exphem.2010.03.005. Epub 2010 Mar 18. Exp Hematol. 2010. PMID: 20303384 Free PMC article.
-
Cancer immune therapy for myeloid malignancies: present and future.Semin Immunopathol. 2019 Jan;41(1):97-109. doi: 10.1007/s00281-018-0693-x. Epub 2018 Jul 9. Semin Immunopathol. 2019. PMID: 29987478 Review.
-
The JAK2V617F mutation is a target for specific T cells in the JAK2V617F-positive myeloproliferative neoplasms.Leukemia. 2017 Feb;31(2):495-498. doi: 10.1038/leu.2016.290. Epub 2016 Oct 20. Leukemia. 2017. PMID: 27761006 No abstract available.
-
Endothelial Immunity Trained by Coronavirus Infections, DAMP Stimulations and Regulated by Anti-Oxidant NRF2 May Contribute to Inflammations, Myelopoiesis, COVID-19 Cytokine Storms and Thromboembolism.Front Immunol. 2021 Jun 25;12:653110. doi: 10.3389/fimmu.2021.653110. eCollection 2021. Front Immunol. 2021. PMID: 34248940 Free PMC article.
References
-
- Gilbert HS. Current management in polycythemia vera. Semin. Hematol. 2001;38:25–28. - PubMed
-
- Liu E, Jelinek J, Pastore YD, Guan Y, Prchal JF, Prchal JT. Discrimination of polycythemias and thrombocytoses by novel, simple, accurate clonality assays and comparison with PRV-1 expression and BFU-E response to erythropoietin. Blood. 2003;101:3294–3301. - PubMed
-
- Lengfelder E, Berger U, Hehlmann R. Interferon alpha in the treatment of polycythemia vera. Ann. Hematol. 2000;79:103–109. - PubMed
-
- Fujii S. Role of interferon-alpha and clonally expanded T cells in the immunotherapy of chronic myelogenous leukemia. Leuk. Lymphoma. 2000;38:21–38. - PubMed
-
- Sacchi S, Kantarjian H, O’Brien S, Cohen PR, Pierce S, Talpaz M. Immune-mediated and unusual complications during interferon alfa therapy in chronic myelogenous leukemia. J. Clin. Oncol. 1995;13:2401–2407. - PubMed
Publication types
MeSH terms
Substances
Grants and funding
LinkOut - more resources
Full Text Sources
Other Literature Sources
