. 2007 Jan 15;34(2):661-70.
doi: 10.1016/j.neuroimage.2006.09.034. Epub 2006 Nov 17.

Patient-specific analysis of the volume of tissue activated during deep brain stimulation

Affiliations

Patient-specific analysis of the volume of tissue activated during deep brain stimulation

Christopher R Butson et al. Neuroimage. .

Abstract

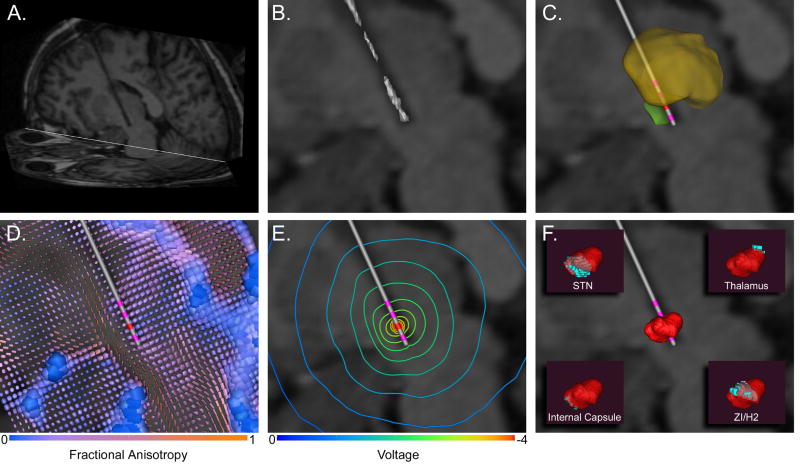
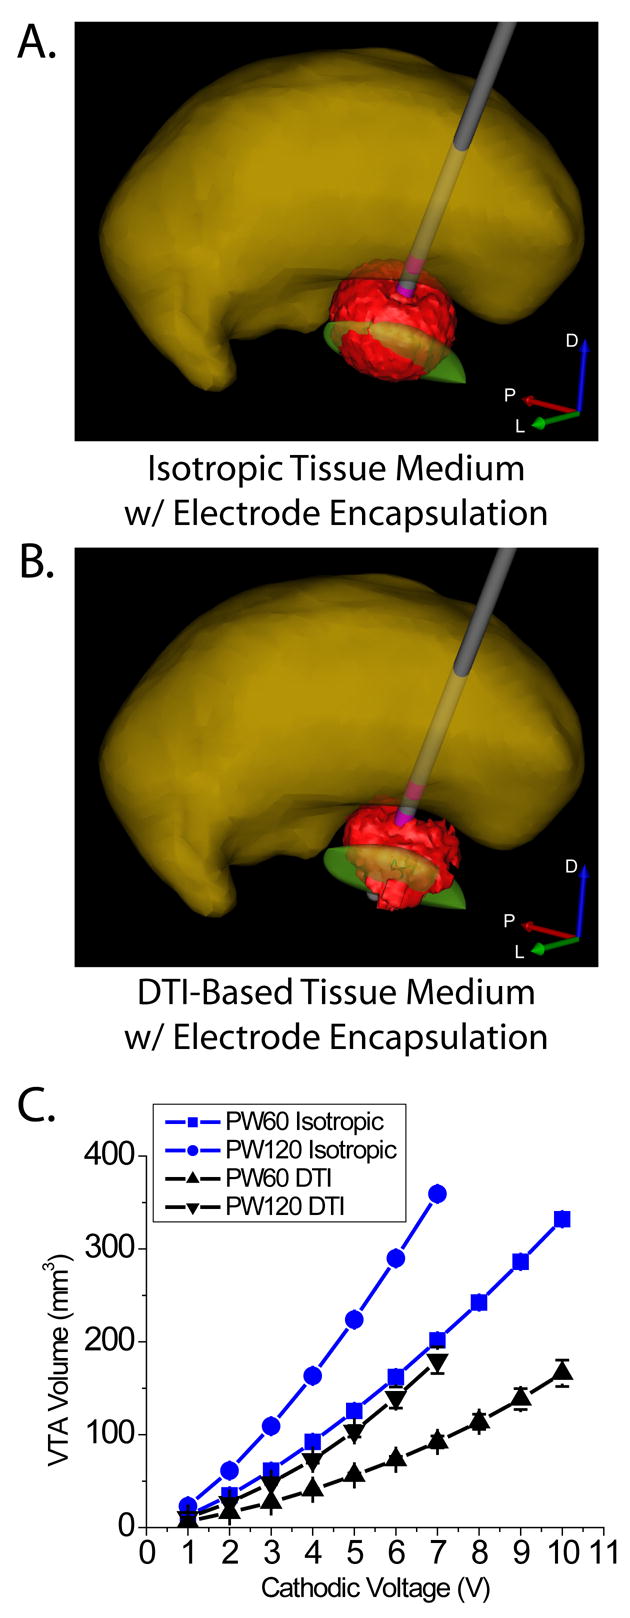
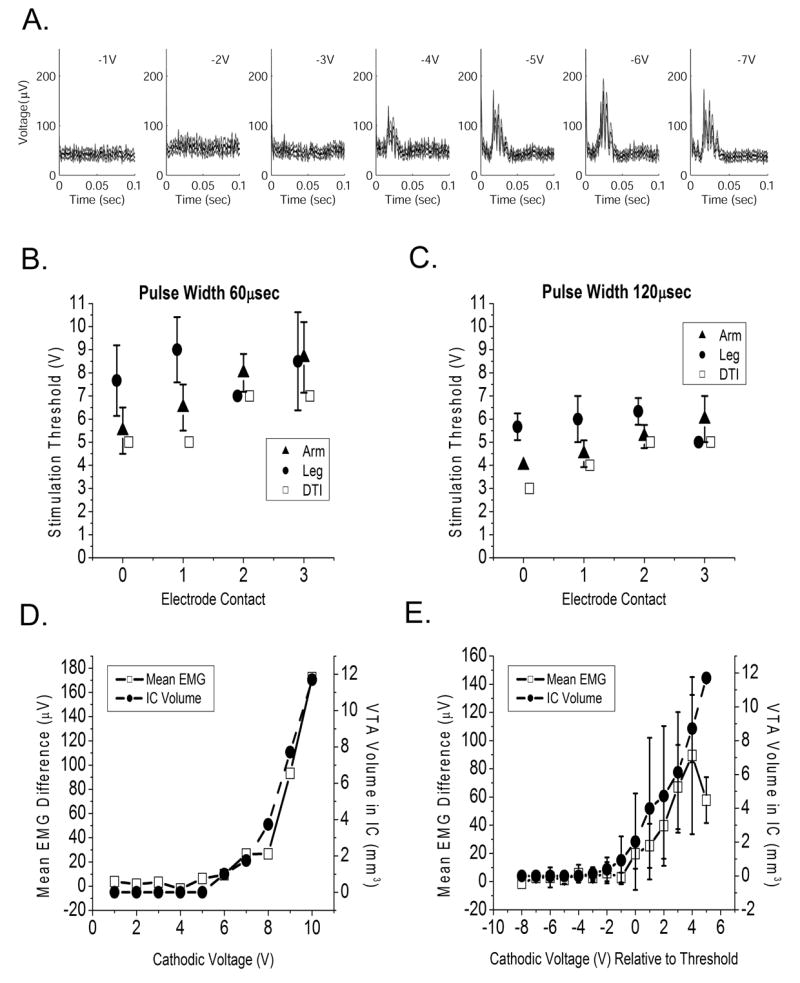
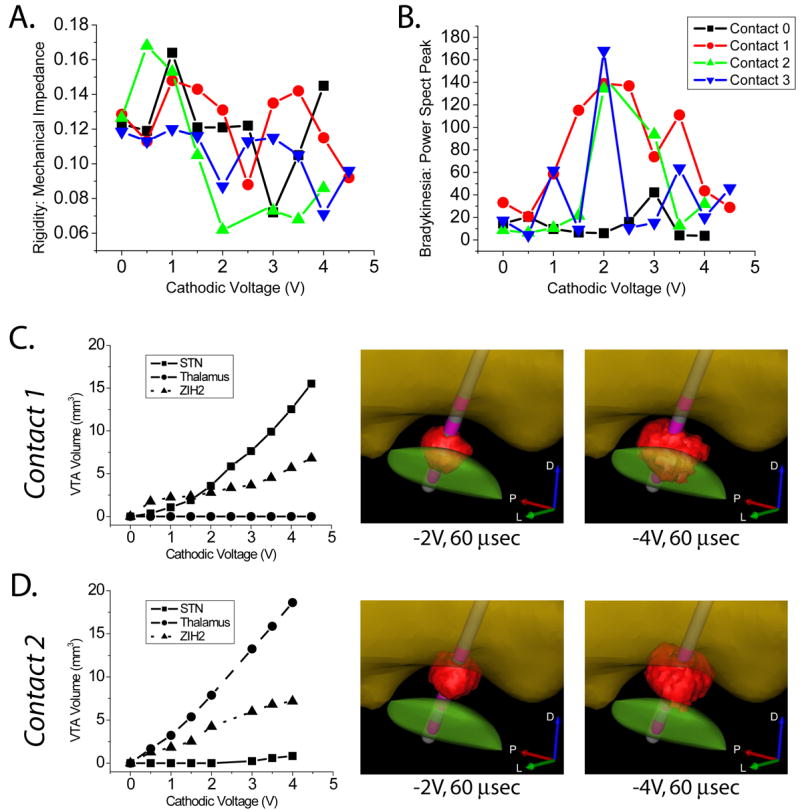
Despite the clinical success of deep brain stimulation (DBS) for the treatment of movement disorders, many questions remain about its effects on the nervous system. This study presents a methodology to predict the volume of tissue activated (VTA) by DBS on a patient-specific basis. Our goals were to identify the intersection between the VTA and surrounding anatomical structures and to compare activation of these structures with clinical outcomes. The model system consisted of three fundamental components: (1) a 3D anatomical model of the subcortical nuclei and DBS electrode position in the brain, each derived from magnetic resonance imaging (MRI); (2) a finite element model of the DBS electrode and electric field transmitted to the brain, with tissue conductivity properties derived from diffusion tensor MRI; (3) VTA prediction derived from the response of myelinated axons to the applied electric field, which is a function of the stimulation parameters (contact, impedance, voltage, pulse width, frequency). We used this model system to analyze the effects of subthalamic nucleus (STN) DBS in a patient with Parkinson's disease. Quantitative measurements of bradykinesia, rigidity, and corticospinal tract (CST) motor thresholds were evaluated over a range of stimulation parameter settings. Our model predictions showed good agreement with CST thresholds. Additionally, stimulation through electrode contacts that improved bradykinesia and rigidity generated VTAs that overlapped the zona incerta/fields of Forel (ZI/H2). Application of DBS technology to various neurological disorders has preceded scientific characterization of the volume of tissue directly affected by the stimulation. Synergistic integration of clinical analysis, neuroimaging, neuroanatomy, and neurostimulation modeling provides an opportunity to address wide ranging questions on the factors linked with the therapeutic benefits and side effects of DBS.


Figures

Figure 1
Figure 1
Modeling Methods. A) The post-operative MRI was used to identify the electrode location, as shown by the halo in the oblique sagittal slice. B) Intensity values around the electrode halo were isosurfaced with progressively lower values until the surface converged onto the electrode contacts. C) The anatomical surfaces from the 3D brain atlas warping were incorporated into the volume with the electrode location (thalamus – yellow; STN – green). D) The anatomical representation of the patient-specific DBS model was co-registered with a DTI atlas brain to account for the 3D tissue anisotropy and inhomogeneity. Each tensor is represented by a superquadric where the shape and size of the individual elements indicate principal direction and conductivity magnitude, while color indicates fractional anisotropy. E) The electric field is modulated by the 3D tissue conductivity tensors as shown in the voltage isolines. F) The VTA (red) is derived from the voltage distribution in the tissue medium. Its intersection with local anatomical volumes (blue) is shown in the insets.
Figure 2
Figure 2
Volume of tissue activated by deep brain stimulation. VTA shape and size differed between isotropic (A) and DTI-based (B) tissue mediums, resulting in differential activation of surrounding anatomical structures. Both models included a tissue encapsulation layer around the electrode shaft, and volumes generated under the two conditions were matched for electrode impedance. C) Average VTA volume +/− standard deviation for all electrode contacts as a function of stimulus voltage for stimulus pulse widths of 60 μsec and 120 μsec.
Figure 3
Figure 3
Corticospinal tract thresholds. A) EMG threshold detection during low frequency stimulation. Each graph shows time-triggered average signal (black line, stimulus occurs at time=0) with 95% confidence intervals (gray lines) for progressively higher magnitude cathodic stimulation as indicated. In this example the CST motor threshold occurred at −4 V. B, C) Average CST threshold voltages are shown for arm and leg muscle groups for stimulus pulse widths of 60 μsec and 120 μsec. Also shown are stimulus thresholds predicted by the patient-specific model by spread of the VTA into the IC. Data values are offset slightly along the x-axis to improve readability. D) Example mean EMG voltage difference (μV) for all stimulus pulses in a 20 second epoch for one channel at one electrode contact are shown as a function of stimulation voltage (V). Also shown is the VTA volume that intersects with internal capsule. E) These data are averaged across all channels and shifted relative to threshold voltage in this representative example for contact 0 at 60 μsec pulse width. The graph shows the mean EMG difference and IC volume +/− standard deviation relative to threshold; these measures were significantly correlated (Spearman coefficient 0.71, p<.01).
Figure 4
Figure 4
Clinical Measures and Stimulation Spread. We observed effects of activation on A) rigidity (lower scores indicate therapeutic improvement) and B) bradykinesia (higher scores indicate therapeutic improvement). Parts A and B share a legend. For both of these measures, the clinical outcome was dependent on the stimulation voltage and the electrode contact. Rigidity improved roughly motonically with voltage, while bradykinesia showed optimal improvement at a distinct voltage which was dependent on the electrode contact, with worsening effects beyond the optimal voltage. C, D) VTA volume within STN, thalamus, and ZI/H2 for contact 1 and contact 2 as a function of the stimulus voltage. Also shown are example VTAs at -2 V and -4 V.

References

    1. Astrom M, Johansson JD, Hariz MI, Eriksson O, Wardell K. The effect of cystic cavities on deep brain stimulation in the basal ganglia: a simulation-based study. J Neural Eng. 2006;3:132–138. - PubMed
    1. Baker KB, Tkach JA, Nyenhuis JA, Phillips M, Shellock FG, Gonzalez-Martinez J, Rezai AR. Evaluation of specific absorption rate as a dosimeter of MRI-related implant heating. J Magn Reson Imaging. 2004;20:315–320. - PubMed
    1. Benabid AL, Pollak P, Gao D, Hoffmann D, Limousin P, Gay E, Payen I, Benazzouz A. Chronic electrical stimulation of the ventralis intermedius nucleus of the thalamus as a treatment of movement disorders. J Neurosurg. 1996;84:203–214. - PubMed
    1. Butson CR, McIntyre CC. Tissue and electrode capacitance reduce neural activation volumes during deep brain stimulation. Clin Neurophysiol. 2005;116:2490–2500. - PMC - PubMed
    1. Butson CR, McIntyre CC. Role of electrode design on the volume of tissue activated during deep brain stimulation. J Neural Eng. 2006;3:1–8. - PMC - PubMed

Publication types