. 2007 Jan;143(1):134-44.
doi: 10.1104/pp.106.089557. Epub 2006 Nov 17.

Decreases in stomatal conductance of soybean under open-air elevation of [CO2] are closely coupled with decreases in ecosystem evapotranspiration

Affiliations

Decreases in stomatal conductance of soybean under open-air elevation of [CO2] are closely coupled with decreases in ecosystem evapotranspiration

Carl J Bernacchi et al. Plant Physiol. 2007 Jan.

Abstract

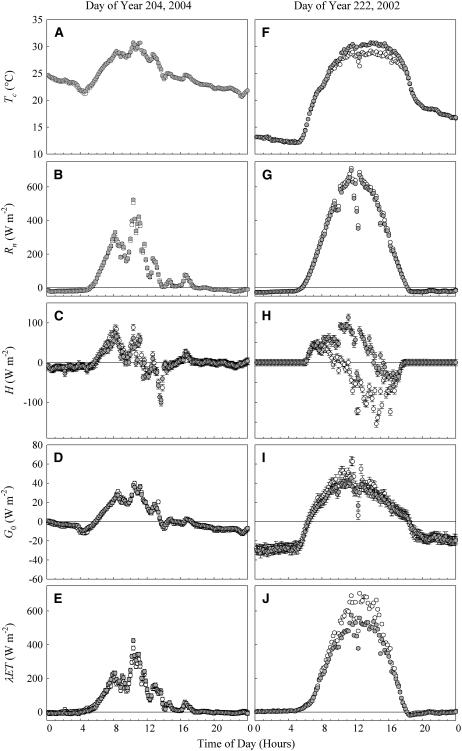
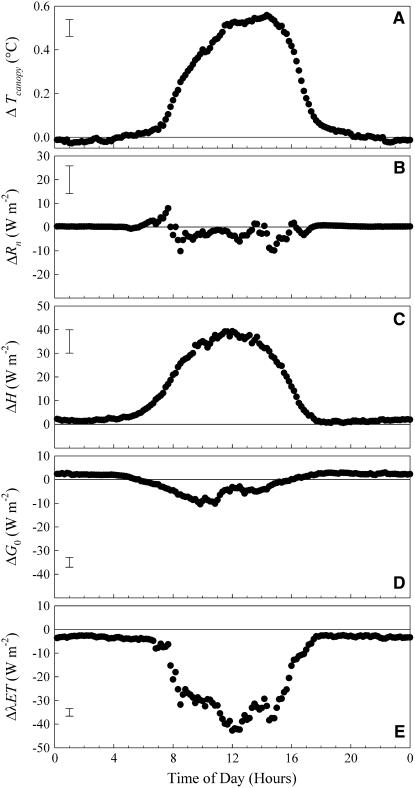
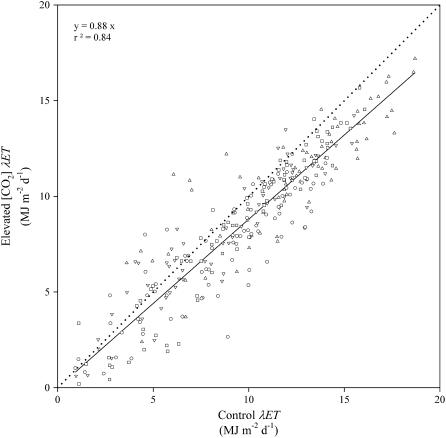
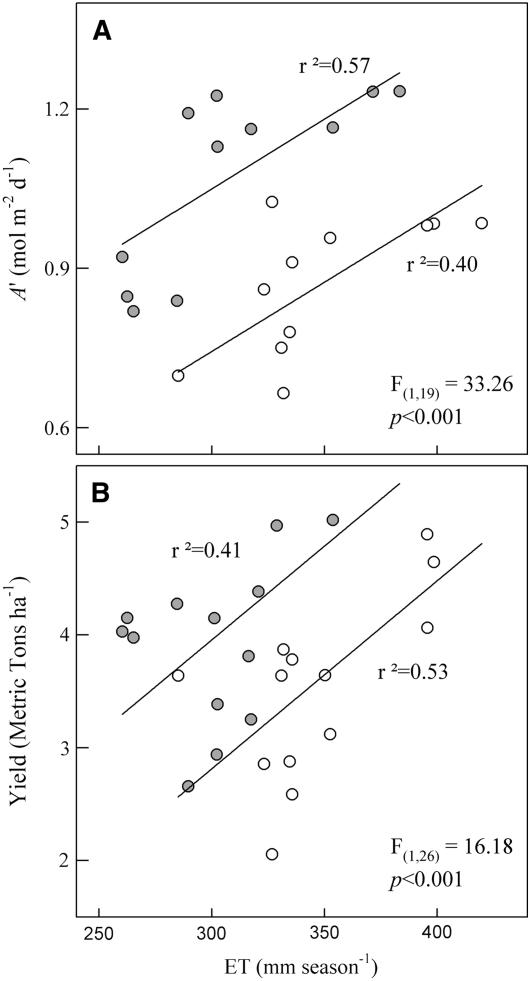
Stomatal responses to atmospheric change have been well documented through a range of laboratory- and field-based experiments. Increases in atmospheric concentration of CO(2) ([CO(2)]) have been shown to decrease stomatal conductance (g(s)) for a wide range of species under numerous conditions. Less well understood, however, is the extent to which leaf-level responses translate to changes in ecosystem evapotranspiration (ET). Since many changes at the soil, plant, and canopy microclimate levels may feed back on ET, it is not certain that a decrease in g(s) will decrease ET in rain-fed crops. To examine the scaling of the effect of elevated [CO(2)] on g(s) at the leaf to ecosystem ET, soybean (Glycine max) was grown in field conditions under control (approximately 375 micromol CO(2) mol(-1) air) and elevated [CO(2)] (approximately 550 micromol mol(-1)) using free air CO(2) enrichment. ET was determined from the time of canopy closure to crop senescence using a residual energy balance approach over four growing seasons. Elevated [CO(2)] caused ET to decrease between 9% and 16% depending on year and despite large increases in photosynthesis and seed yield. Ecosystem ET was linked with g(s) of the upper canopy leaves when averaged across the growing seasons, such that a 10% decrease in g(s) results in a 8.6% decrease in ET; this relationship was not altered by growth at elevated [CO(2)]. The findings are consistent with model and historical analyses that suggest that, despite system feedbacks, decreased g(s) of upper canopy leaves at elevated [CO(2)] results in decreased transfer of water vapor to the atmosphere.


Figures

Figure 1.
Figure 1.
A, Mean daily minimum (black bars) and maximum (gray bars) temperatures (±1 se) recorded at a weather station at the SoyFACE research facility in Champaign, IL, over the duration of this experiment. Seasonal 30-year mean maximum and minimum temperatures are represented by dotted lines from a weather station located within 3 km of SoyFACE. B, Seasonal (May–August) mean PCMI (Palmer, 1968; bars) and the mean (May–August) 30-year average PCMI value (dotted line) for Illinois Climate Division 5, which includes SoyFACE. C, Average daily totals (±1 se; bars) from May to August for each growing season and the 30-year running mean daily total solar radiation (dotted line).
Figure 2.
Figure 2.
Tc, Rn, H, G0, and λET for control (white circles) and elevated [CO2] (gray circles) over an example overcast and an example sunny day. The maximum and minimum temperatures on DOY 204 (2004) were 29.5°C and 21.8°C, and were 29.4°C and 13°C for DOY 222 (2002). Each symbol represents a mean of four replicate blocks for DOY 204 (2004) and three replicate blocks for DOY 222 (2002). Error bars represent 1 se around the mean.
Figure 3.
Figure 3.
The average diurnal course of the absolute differences between elevated [CO2] and control plots for Tc (A), Rn (B), H (C), G0 (D) and λET (E). Each point represents a 10-min interval of the day averaged across more than 300 measurement days and three to four replicate blocks, depending on the year. Values are presented as elevated [CO2] minus control, such that negative represents higher values in the control plots and positive higher in the elevated [CO2]. Bars on the upper (A, B, C) and lower (D and E) left side of the figures represent the 1 se around the mean.
Figure 4.
Figure 4.
The relationship between ET for elevated [CO2]-grown soybean and control-grown soybean over four complete growing seasons. Each symbol represents the mean of three to four replicate blocks, depending on the year. Different symbols represent separate measurement years (▵ for 2002, ∇ for 2003, ○ for 2004, and □ for 2005). The linear regression was fit to all data with an intercept of zero because prior regression analysis showed the intercept not statistically different from zero. The slope is statistically significant from unity with the 99% confidence limits of the slope ranging from 0.86 to 0.90.
Figure 5.
Figure 5.
The relationship of ET to gs based on several days of simultaneous measurements across the 2002, 2003, and 2004 growing seasons. Stomatal conductance of the upper canopy leaves was averaged across the daylight hours and days of measurement (Bernacchi et al., 2006). Total season ET for each plot is plotted against its corresponding gs; control (white symbols) and elevated [CO2] (gray symbols). Since no differences between control and elevated [CO2] were observed based on analysis of covariance with treatment as the main effect and gs as a covariance term (F(1,19) = 1.07, P = 0.31), a linear regression was fit to data for both the control and elevated [CO2] plots over all 4 years.
Figure 6.
Figure 6.
A and B, Daily integrated leaf-level carbon assimilation (A′; Bernacchi et al., 2006; A) and yield (2002–2003 from Morgan et al., 2005; 2004–2005 from R. Nelson, personal communication; B) were plotted against ET. Statistical significance reported in each section represents the results from an analysis of covariance, with ET as the covariance term and treatment as the main effect.
Figure 7.
Figure 7.
A subset of data from a period in 2003 showing maximum daily temperature, total daily integrated solar radiation, and precipitation (A); ET from 11 am until 1 pm (Central solar time) for soybean grown at SoyFACE under control (white symbols) and elevated [CO2] (gray symbols; B); and the difference of λET for elevated [CO2] versus control treatments (C). After 9 d with only minimal precipitation, the elevated [CO2] plots begin to show higher rates of λET compared with the control, the opposite to the usual response seen when water is not limiting. Each symbol represents a mean of four replicates and error bars represent 1 se around the mean.

References

    1. Ainsworth EA, Davey PA, Bernacchi CJ, Dermody OC, Heaton EA, Moore DJ, Morgan PB, Naidu SL, Ra HSY, Zhu XG, et al (2002) A meta-analysis of elevated [CO2] effects on soybean (Glycine max) physiology, growth and yield. Glob Change Biol 8 695–709
    1. Ainsworth EA, Long SP (2005) What have we learned from 15 years of free-air CO2 enrichment (FACE)? A meta-analytic review of the responses of photosynthesis, canopy. New Phytol 165 351–371 - PubMed
    1. Ainsworth EA, Rogers A, Nelson R, Long SP (2004) Testing the “source-sink” hypothesis of down-regulation of photosynthesis in elevated [CO2] in the field with single gene substitutions in Glycine max. Agric For Meteorol 122 85–94
    1. Alley RB, Marotzke J, Nordhaus WD, Overpeck JT, Peteet DM, Pielke RA Jr, Pierrehumbert RT, Rhines PB, Stocker TF, Talley LD, et al (2003) Abrupt climate change. Science 299 2005–2010 - PubMed
    1. Arnell N, Liu C (2001) Hydrology and water resources. Climate change 2001: impacts, adaptation, and vulnerability. In JJ McCarthy, OF Canziani, NA Leary, DJ Dokken, KS White, eds, Third Assessment Report of the Intergovernmental Panel on Climate Change. Cambridge University Press, Cambridge, UK, pp 192–236

Publication types

LinkOut - more resources