. 2007 Jan;143(1):389-99.
doi: 10.1104/pp.106.089326. Epub 2006 Nov 17.

Tobacco nectaries express a novel NADPH oxidase implicated in the defense of floral reproductive tissues against microorganisms

Affiliations

Tobacco nectaries express a novel NADPH oxidase implicated in the defense of floral reproductive tissues against microorganisms

Clay Carter et al. Plant Physiol. 2007 Jan.

Abstract

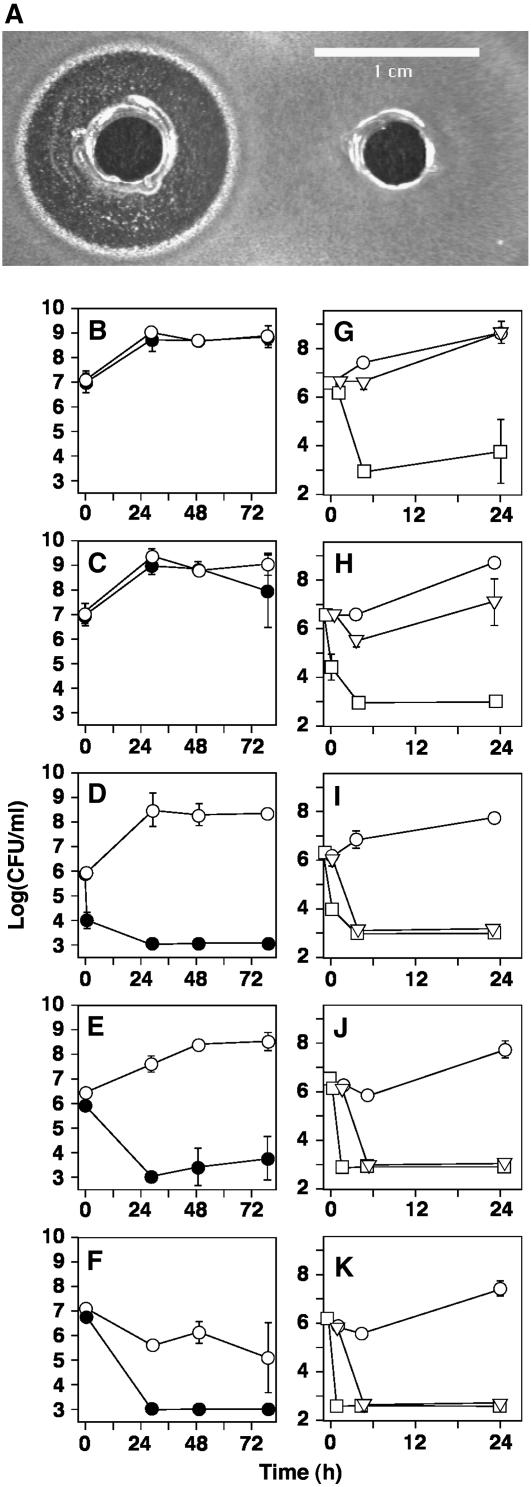
Hydrogen peroxide produced from the nectar redox cycle was shown to be a major factor contributing to inhibition of most microbial growth in floral nectar; however, this obstacle can be overcome by the floral pathogen Erwinia amylovora. To identify the source of superoxide that leads to hydrogen peroxide accumulation in nectary tissues, nectaries were stained with nitroblue tetrazolium. Superoxide production was localized near nectary pores and inhibited by diphenylene iodonium but not by cyanide or azide, suggesting that NAD(P)H oxidase is the source of superoxide. Native PAGE assays demonstrated that NADPH (not NADH) was capable of driving the production of superoxide, diphenyleneiodonium chloride was an efficient inhibitor of this activity, but cyanide and azide did not inhibit. These results confirm that the production of superoxide was due to an NADPH oxidase. The nectary enzyme complex was distinct by migration on gels from the leaf enzyme complex. Temporal expression patterns demonstrated that the superoxide production (NADPH oxidase activity) was coordinated with nectar secretion, the expression of Nectarin I (a superoxide dismutase in nectar), and the expression of NOX1, a putative gene for a nectary NADPH oxidase that was cloned from nectaries and identified as an rbohD-like NADPH oxidase. Further, in situ hybridization studies indicated that the NADPH oxidase was expressed in the early stages of flower development although superoxide was generated at later stages (after Stage 10), implicating posttranslational regulation of the NADPH oxidase in the nectary.


Figures

Figure 1.
Figure 1.
Effect of nectar H2O2 on the growth of microorganisms. A, Left, A lawn of oxyR E. coli was plated and 10 μL of nectar was added to the central well. After overnight development, a ring of growth inhibition was observed (left) or the nectar was incubated for 15 min with 1 μL of 1 mg/mL catalase to destroy the H2O2 prior to placement in the well (right). B to F, Growth of selected bacterial strains in raw nectar (black circles) or nectar that was preincubated (15 min) with 1 μL of 0.5 mg/mL catalase (white circles). Each point represents the mean ± sd (n = 4). Data are representative of two independent experiments. G to K, Survival of selected bacterial strains in the absence (circles) or in the presence of 4 mm (triangles) and 40 mm (squares) H2O2 in a minimal medium. Each point represents the mean ± sd (n = 3). Data are representative of two independent experiments. The limit of detection was 3 log (colony forming units/mL). B and G, E. amylovora; C and H, P. agglomerans; D and I, P. syringae; E and J, P. fluorescens; and F and K, S. typhimurium.
Figure 2.
Figure 2.
Staining of superoxide in mature Stage 12 floral nectaries of ornamental tobacco with NBT. A, Side view of gynoecium with orange basal nectary stained with NBT. B, View of a median-longitudinal slice through gynoecium and basal nectary taken after rotating the gynoecium in A by 90 degrees, showing the symmetrical staining pattern associated with both nectary pore regions. C, Tangential vibratome section of nectary pore region. a–b and a–c indicate two transects representing vibratome planes of sections shown in D and E, respectively. D, Cross section through the a–b transect of the NBT-stained nectary pore region showing depth of staining, flattened outer appearance of pore, and flattened, stained cells. E, Cross section a–c transect showing the periphery of the pore region with robust, unstained cells. F, Portion of cross section through gynoecium at the level of the locules showing the placenta or transmission tract with vascular bundles (t), ovary wall (w), and ovules (o). Some of the connective tissue (c) also stains positive for NBT. Bars = 1 mm on A and B; 200 μm on C, D, and E; and 250 μm on F.
Figure 3.
Figure 3.
Inhibition of superoxide production by DPI. Top row, 1 through 5, mature Stage 12 gynoecia stained with NBT. Bottom row, 6 through 10, mature Stage 12 gynoecia stained with NBT, as in the top row, except the solution also contained 50 μm DPI.
Figure 4.
Figure 4.
Native PAGE assay for NADPH oxidase. A, NADPH dependency of superoxide production. Approximately 12 nectaries were homogenized in 550 mL of 1 m NaCl, 50 mm sodium phosphate, pH 6.8, and centrifuged at 10,000g for 15 min at 4°C. Protein (100 mg) from each supernatant was electrophoresed on native, nondenaturing polyacrylamide gels. The gels were then stained with 0.5 mg/mL NBT for 30 min at 20°C. Nectary tissues were amended with: lane 1, no added dinucleotides; lane 2, 140 mm NADH; and lane 3, 140 mm NADPH. B, Comparison of enzyme activities in leaf and nectaries. Lanes 1 and 3 contained 100 μg of leaf proteins, and lanes 2, 4, and 5 contained 100 μg of nectary proteins that were amended with: lanes 1 and 2, no added nucleotides; lanes 3 and 4, 140 mm NADPH; and lane 5, 140 mm NADPH plus 6 mm DPI. C, Inhibition of NADPH oxidase activity. All lanes contained 100 μg of extracted nectary proteins that were incubated with NBT containing 140 mm NADPH and were preincubated with: lane 1, no inhibitor; lane 2, 10 mm DPI for 10 min; lane 3, 10 mm NaCN for 15 min; and lane 4, 10 mm NaN3 for 15 min.
Figure 5.
Figure 5.
Coordination of Nectarin I expression with superoxide production. A, Expression of chloramphenicol acetyl transferase in different developmental stages of floral nectaries from Tr461 transgenic plants (NEC1-CAT; Carter and Thornburg, 2003). The floral stages are Stage 6, mid-filling stage, presecretory; Stage 8, late-filling stage, presecretory; Stage 10, early maturation stage, just prior to nectar secretion; and Stage 12, fully secretory nectaries at anthesis. a, Nonacetylated [14C]chloramphenicol; b, [14C]chloramphenicol-l-acetate; and c, [14C]chloramphenicol-3-acetate. Gynoecia from different staged (6, 8, 10, and 12) flowers stained with NBT as in Figure 2.
Figure 6.
Figure 6.
Nectary-expressed NADPH oxidase clone. A, Alignment of the cloned NOX1 clone with the N. tabacum rbohD clone (GenBank AF506374). B, Phylogenetic analysis of NOX1 and related gp91phox genes. This analysis was restricted to the homologous 200-amino acid region from each of these clones. The ClustalW analysis was conducted online at the Kyoto University Bioinformatics Center Web site (http://clustalw.genome.jp/). Clones used in this analysis (with GenBank or TAIR identifiers) were as follows: LxS NOX1, DQ497543; At_rbohA, At5g07390; At_rbohB, At1g09090; At_rbohC, At5g51060; At_rbohD, At3g45610; At_rbohD-like, At5g60010; At_rbohE, At1g19230; At_rbohF, At1g64060; At_rbohF-like, At4g11230; Le_WFI_rboh, AF148534; Nb_rbohB, AB079499; Nt_rbohD, AF506374; Nt_rbohF, AJ302505; St_rbohA, AB050600; St_rbohB, AB050661; St_rbohC, AB198716; St_rbohD, AB198717; and St_rbohF, AB064343.
Figure 7.
Figure 7.
Localization of NEC1 mRNA and protein in nectaries. A, Longitudinal paraffin section of tobacco nectary tissues at Stage 12 of development probed with antisense strand of the NEC1 clone showing positive localization (blue coloration) of NEC1 mRNA in special parenchyma cells. B, Higher magnification of A showing expression of NEC1 mRNA. C, Sense control for NEC1 mRNA. D, Resin section showing positive immunocytochemical reaction for NEC1 protein in nectary cells. Silver-enhanced gold (bright spots in phase contrast mode) occurs in cytoplasm and is concentrated near and in cell walls. E, Adjacent control section to that in D but with primary antibody deleted from procedure. Bars = 200 μm on A; 50 μm on B and C; and 25 μm on D and E.
Figure 8.
Figure 8.
In situ localization of NOX1 in nectaries. A and B, Tobacco nectaries at Stage 12 of development probed with antisense strand of the NOX1 clone. Inset of A shows that cytoplasmic strands are positively stained in epidermis. C, Tobacco nectaries at Stage 12 of development probed with the sense strand of the NOX1 clone showing cells of nectary are not stained. D, Tobacco nectaries at Stage 6 of development probed with antisense strand of the NOX1 clone. Epidermis is to the right. Staining does not extend out to the epidermis at this earlier stage. E, Soybean nectaries at an active stage probed with antisense strand of the NOX1 clone. F, Higher magnification of the central portion of soybean nectary showing a similar cytoplasmic staining pattern as that seen in E. Bars = 50 μm for A to E; 25 μm for A insert and B insert; and 20 μm for F.

References

    1. Ankri S, Mirelman D (1999) Antimicrobial properties of allicin from garlic. Microbes Infect 1 125–129 - PubMed
    1. Ausubel FM, Brent R, Kingston RE, Moore DD, Seidman JG, Smith JA, Struhl K (1992) Short Protocols in Molecular Biology, Ed 2. John Wiley & Sons, New York
    1. Baker HG, Baker I (1971) Amino acids in nectar and their evolutionary significance. Nature 241 543–545
    1. Bokoch GM, Diebold BA (2002) Current molecular models for NADPH oxidase regulation by Rac GTPase. Blood 100 2692–2696 - PubMed
    1. Bolwell G, Butt V, Davies D, Zimmerlin A (1995) The origin of the oxidative burst in plants. Free Radic Res 23 517–532 - PubMed

Publication types

MeSH terms

Associated data

LinkOut - more resources