. 2006 Nov 28;103(48):18296-301.
doi: 10.1073/pnas.0608549103. Epub 2006 Nov 17.

Genomic analysis of the uncultivated marine crenarchaeote Cenarchaeum symbiosum

Affiliations

Genomic analysis of the uncultivated marine crenarchaeote Cenarchaeum symbiosum

Steven J Hallam et al. Proc Natl Acad Sci U S A. .

Abstract

Crenarchaeota are ubiquitous and abundant microbial constituents of soils, sediments, lakes, and ocean waters. To further describe the cosmopolitan nonthermophilic Crenarchaeota, we analyzed the genome sequence of one representative, the uncultivated sponge symbiont Cenarchaeum symbiosum. C. symbiosum genotypes coinhabiting the same host partitioned into two dominant populations, corresponding to previously described a- and b-type ribosomal RNA variants. Although they were syntenic, overlapping a- and b-type ribotype genomes harbored significant variability. A single tiling path comprising the dominant a-type genotype was assembled and used to explore the genomic properties of C. symbiosum and its planktonic relatives. Of 2,066 ORFs, 55.6% matched genes with predicted function from previously sequenced genomes. The remaining genes partitioned between functional RNAs (2.4%) and hypotheticals (42%) with limited homology to known functional genes. The latter category included some genes likely involved in the archaeal-sponge symbiotic association. Conversely, 525 C. symbiosum ORFs were most highly similar to sequences from marine environmental genomic surveys, and they apparently represent orthologous genes from free-living planktonic Crenarchaeota. In total, the C. symbiosum genome was remarkably distinct from those of other known Archaea and shared many core metabolic features in common with its free-living planktonic relatives.


Conflict of interest statement

The authors declare no conflict of interest.

Figures

Fig. 1.
Fig. 1.
C. symbiosum fosmid population structure. (Upper) Fosmids partition into two distinct population bins corresponding to a-type and b-type ribosomal variants. Average nucleotide identity of each fully sequenced fosmid is plotted against the position of each fosmid in the assembled a-type scaffold. Blue lines represent the set of fosmids falling within the a-type population, and red lines indicate the set of fosmids falling within the b-type population. (Insets) Histograms represent the overall sequence divergence among overlapping fosmids. The distribution of observed sequence similarity (percentage identity) in high-scoring segment pairs for alignments between fosmid clones assigned to population “a” (Left), between “a + b” populations (Center), and between fosmid clones assigned to population “b” (Right). (Lower) Number of nucleotide polymorphisms per 1 kb of orthologous sequence shared between overlapping fosmids within the a-type population exhibiting >95% nucleotide identity to the genomic scaffold. Gaps in the distribution represent genomic intervals covered by a single fosmid clone (see Supporting Text). ⋀, Dashed line represents identity cut-off (≈92% average nucleotide identity) for type-a fosmids used in tiling path construction *, Sequence divergence within type-a fosmids based on comparison of fosmids sharing >95% average nucleotide identity.
Fig. 2.
Fig. 2.
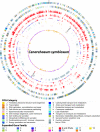
The C. symbiosum genome. Nested circles from outermost to innermost represent the following information. (i) Gene content predicted on the forward strand. (ii) Gene content predicted on the reverse strand. The color of predicted ORFs is based on COG functional categories (see key for color designations). (iii) Conservation of predicted C. symbiosum genes in the unassembled set of WGS data from the SAR. (iv) Conservation of predicted C. symbiosum genes in the set of published and completed microbial genomes (see Supporting Text). The height of the bars in circles 3 and 4 indicates the BSR for the set of predicted C. symbiosum proteins, queried against the public genomes and SAR, respectively, spanning a range of BSR values between ≈30% and 100% amino acid identity. (v) The extent of polymorphisms within the type-a population shown in Fig. 1 mapped on the genome (see Fig. 1 for details). (vi) Expanded gene families (discussed in the text; see key for color designations and Table 6 for additional information); note that high numbers of polymorphisms (circle 5) frequently coincide with the expanded protein families. (vii) tRNA and rRNA gene positions. (viii) G + C content deviation from the mean (57.5%) in 1,000-bp windows.
Fig. 3.
Fig. 3.
Comparative analysis of C. symbiosum and SAR sample bins. Coverage plots for individual SAR sample bins aligned to the C. symbiosum genomic scaffold (see Materials and Methods). Each vertical bar represents an individual WGS read. The y axis on each plot corresponds to the percentage amino acid sequence similarity for each aligning read. The average percentage amino acid identity (top) and similarity (bottom) for SAR WGS reads aligning to the C. symbiosum genome is shown to the far right of each coverage plot. For simplified visualization of gaps in the alignment, all matches are replotted near the base of the x axis to form a normalized 1D plot spanning the reference sequence. To illustrate the gene content of gaps within the distribution of aligning WGS reads, several regions corresponding to expanded gene families 1–3 (Table 4) unique to the C. symbiosum genome are highlighted. (For coverage plots for SAR sample 3 aligned to five archaeal reference genomes, see Fig. 7, which is published as supporting information on the PNAS web site.)

References

    1. Robertson CE, Harris JK, Spear JR, Pace NR. Curr Opin Microbiol. 2005;8:638–642. - PubMed
    1. Woese CR, Kandler O, Wheelis ML. Proc Natl Acad Sci USA. 1990;87:4576–4579. - PMC - PubMed
    1. Karner MB, DeLong EF, Karl DM. Nature. 2001;409:507–510. - PubMed
    1. DeLong EF. Proc Natl Acad Sci USA. 1992;89:5685–5689. - PMC - PubMed
    1. Fuhrman JA, McCallum K, Davis AA. Nature. 1992;356:148–149. - PubMed

Publication types

Associated data