

CoXpress: differential co-expression in gene expression data
- PMID: 17116249
- PMCID: PMC1660556
- DOI: 10.1186/1471-2105-7-509
CoXpress: differential co-expression in gene expression data
Abstract
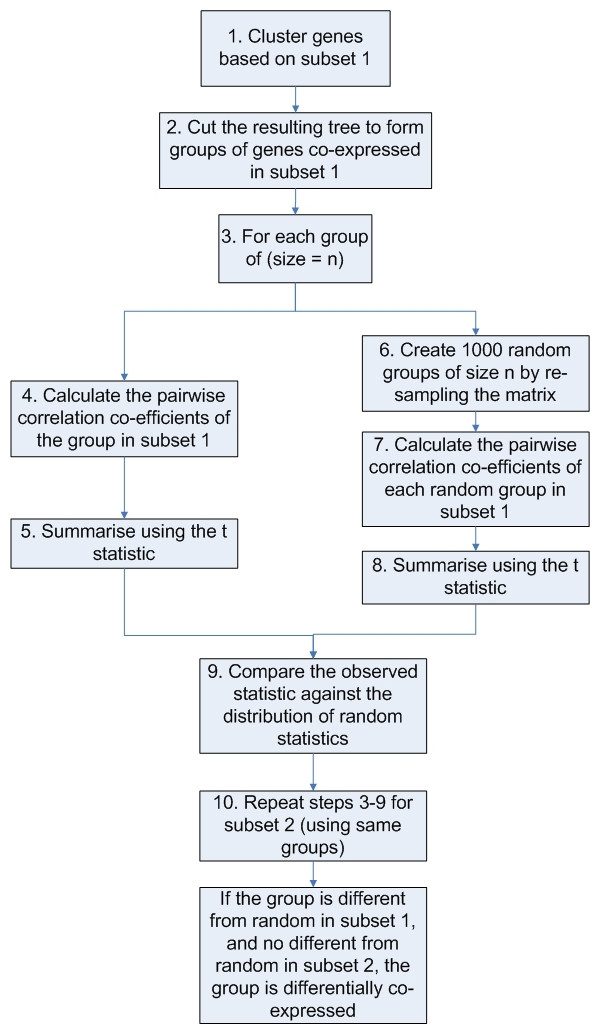
Background: Traditional methods of analysing gene expression data often include a statistical test to find differentially expressed genes, or use of a clustering algorithm to find groups of genes that behave similarly across a dataset. However, these methods may miss groups of genes which form differential co-expression patterns under different subsets of experimental conditions. Here we describe coXpress, an R package that allows researchers to identify groups of genes that are differentially co-expressed.
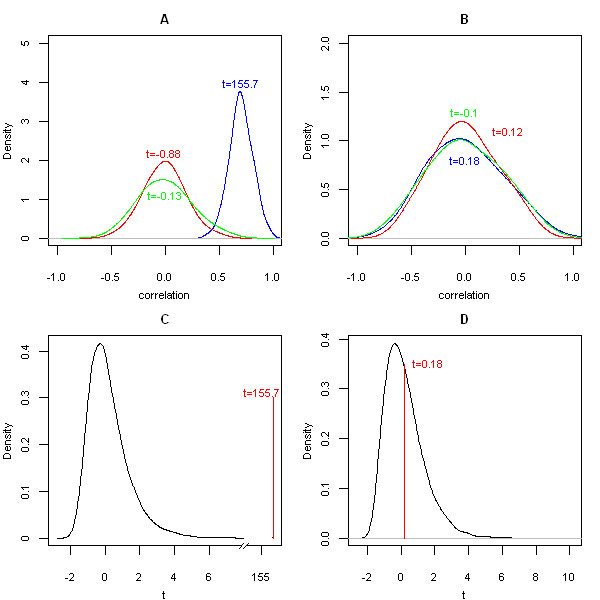
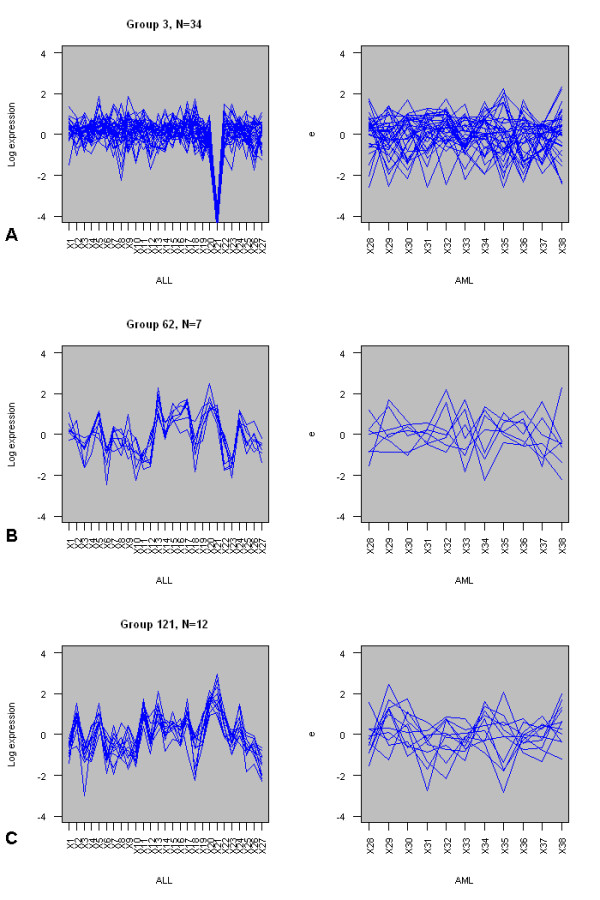
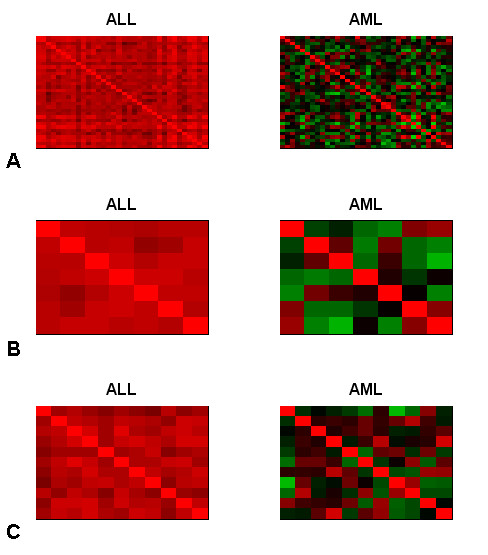
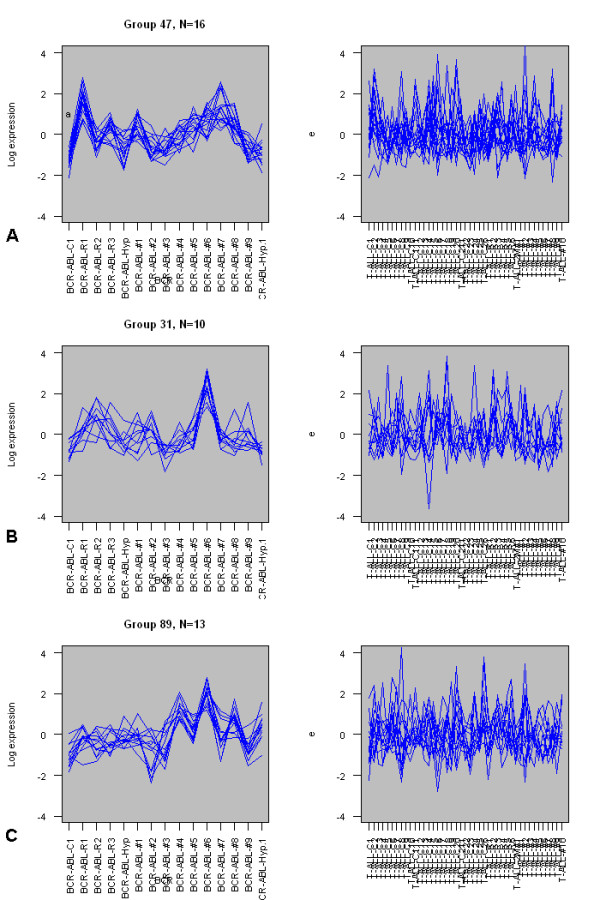
Results: We have developed coXpress as a means of identifying groups of genes that are differentially co-expressed. The utility of coXpress is demonstrated using two publicly available microarray datasets. Our software identifies several groups of genes that are highly correlated under one set of biologically related experiments, but which show little or no correlation in a second set of experiments. The software uses a re-sampling method to calculate a p-value for each group, and provides several methods for the visualisation of differentially co-expressed genes.
Conclusion: coXpress can be used to find groups of genes that display differential co-expression patterns in microarray datasets.
Figures
Similar articles
-
Mining gene expression data by interpreting principal components.BMC Bioinformatics. 2006 Apr 7;7:194. doi: 10.1186/1471-2105-7-194. BMC Bioinformatics. 2006. PMID: 16600052 Free PMC article.
-
Quadratic regression analysis for gene discovery and pattern recognition for non-cyclic short time-course microarray experiments.BMC Bioinformatics. 2005 Apr 25;6:106. doi: 10.1186/1471-2105-6-106. BMC Bioinformatics. 2005. PMID: 15850479 Free PMC article.
-
A stable iterative method for refining discriminative gene clusters.BMC Genomics. 2008 Sep 16;9 Suppl 2(Suppl 2):S18. doi: 10.1186/1471-2164-9-S2-S18. BMC Genomics. 2008. PMID: 18831783 Free PMC article.
-
Many accurate small-discriminatory feature subsets exist in microarray transcript data: biomarker discovery.BMC Bioinformatics. 2005 Apr 13;6:97. doi: 10.1186/1471-2105-6-97. BMC Bioinformatics. 2005. PMID: 15826317 Free PMC article.
-
Robust multi-scale clustering of large DNA microarray datasets with the consensus algorithm.Bioinformatics. 2006 Jan 1;22(1):58-67. doi: 10.1093/bioinformatics/bti746. Epub 2005 Oct 27. Bioinformatics. 2006. PMID: 16257984
Cited by
-
Dissecting the dynamics of dysregulation of cellular processes in mouse mammary gland tumor.BMC Genomics. 2009 Dec 13;10:601. doi: 10.1186/1471-2164-10-601. BMC Genomics. 2009. PMID: 20003387 Free PMC article.
-
Differential Co-expression and Regulatory Network Analysis Uncover the Relapse Factor and Mechanism of T Cell Acute Leukemia.Mol Ther Nucleic Acids. 2018 Sep 7;12:184-194. doi: 10.1016/j.omtn.2018.05.003. Epub 2018 May 29. Mol Ther Nucleic Acids. 2018. PMID: 30195757 Free PMC article.
-
Nkx3-1 and Fech genes might be switch genes involved in pituitary non-functioning adenoma invasiveness.Sci Rep. 2021 Oct 22;11(1):20943. doi: 10.1038/s41598-021-00431-2. Sci Rep. 2021. PMID: 34686726 Free PMC article.
-
Identification of Biomarker and Co-Regulatory Motifs in Lung Adenocarcinoma Based on Differential Interactions.PLoS One. 2015 Sep 24;10(9):e0139165. doi: 10.1371/journal.pone.0139165. eCollection 2015. PLoS One. 2015. PMID: 26402252 Free PMC article.
-
Differentially Coexpressed Disease Gene Identification Based on Gene Coexpression Network.Biomed Res Int. 2016;2016:3962761. doi: 10.1155/2016/3962761. Epub 2016 Nov 30. Biomed Res Int. 2016. PMID: 28042568 Free PMC article.
References
-
- Stekel D. Microarray Bioinformatics. Cambridge University Press; 2003.
Publication types
MeSH terms
LinkOut - more resources
Full Text Sources
