. 2006 Nov 27;203(12):2627-38.
doi: 10.1084/jem.20060667. Epub 2006 Nov 20.

Identification of a radio-resistant and cycling dermal dendritic cell population in mice and men

Affiliations

Identification of a radio-resistant and cycling dermal dendritic cell population in mice and men

Milena Bogunovic et al. J Exp Med. .

Abstract

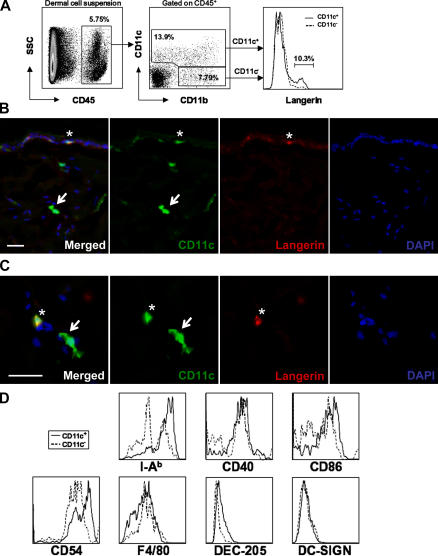
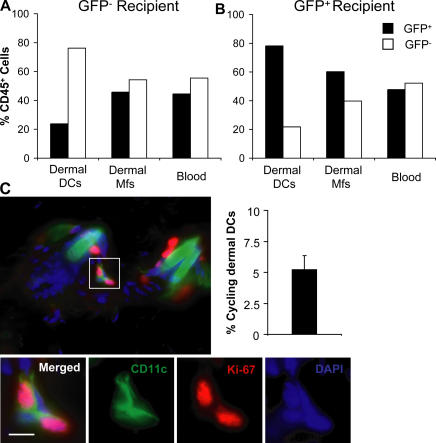
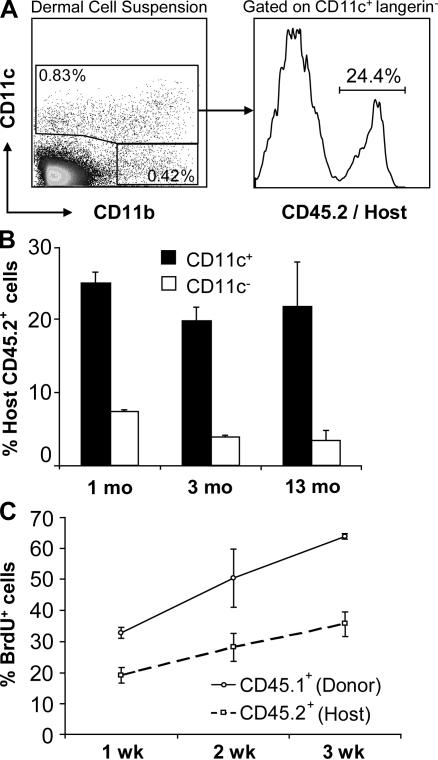
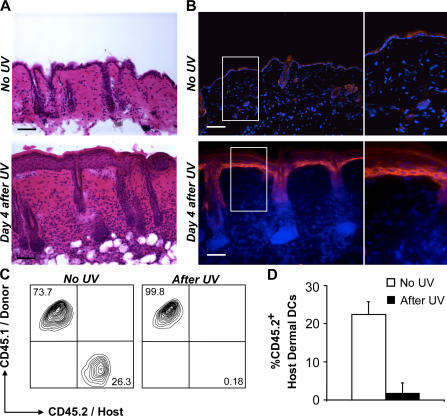
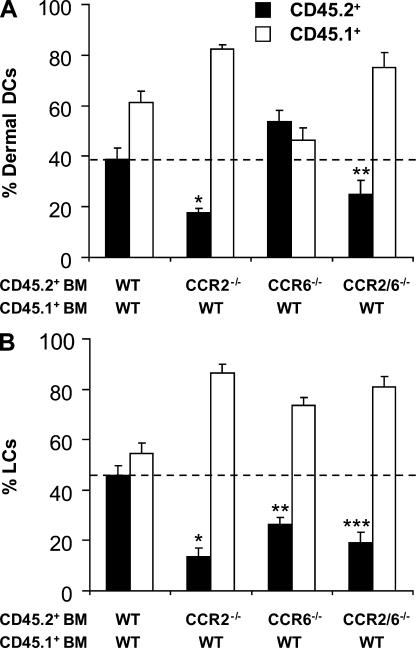
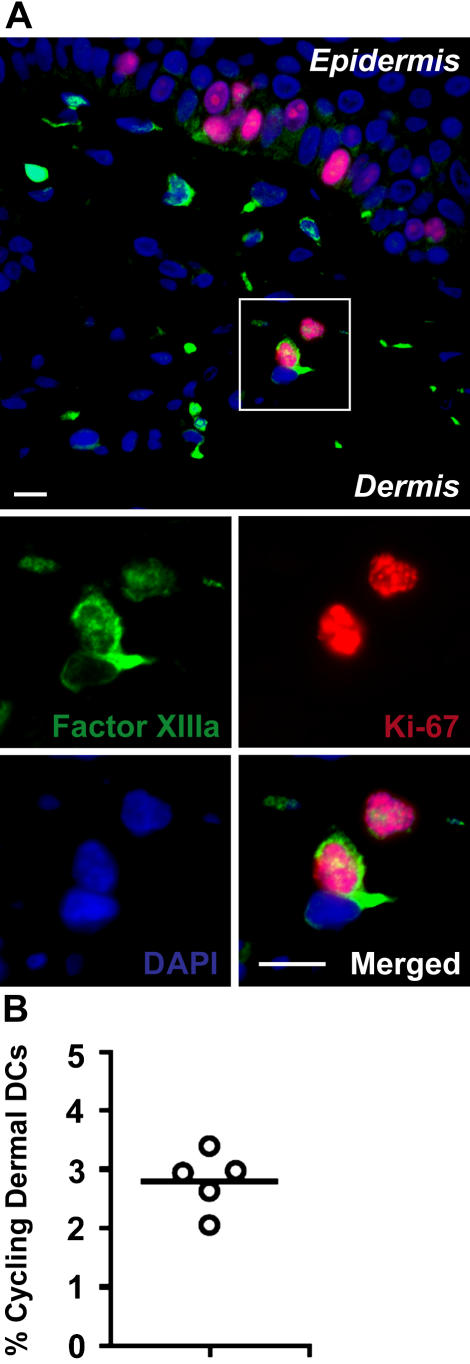
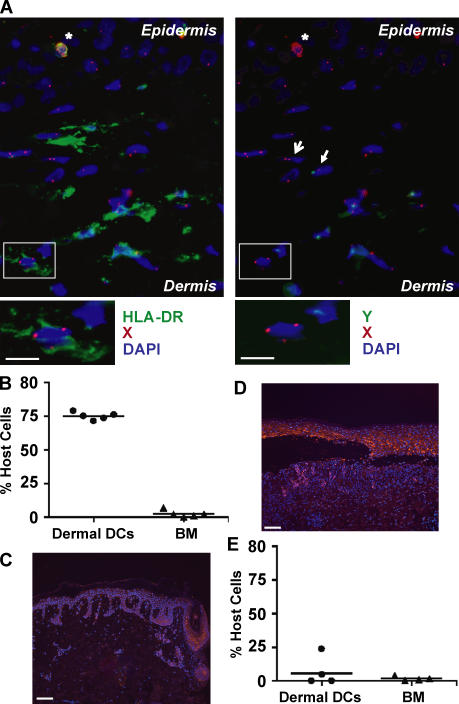
In this study, we explored dermal dendritic cell (DC) homeostasis in mice and humans both in the steady state and after hematopoietic cell transplantation. We discovered that dermal DCs proliferate in situ in mice and human quiescent dermis. In parabiotic mice with separate organs but shared blood circulation, the majority of dermal DCs failed to be replaced by circulating precursors for >6 mo. In lethally irradiated mice injected with donor congenic bone marrow (BM) cells, a subset of recipient DCs remained in the dermis and proliferated locally throughout life. Consistent with these findings, a large proportion of recipient dermal DCs remained in patients' skin after allogeneic hematopoietic cell transplantation, despite complete donor BM chimerism. Collectively, our results oppose the traditional view that DCs are nondividing terminally differentiated cells maintained by circulating precursors and support the new paradigm that tissue DCs have local proliferative properties that control their homeostasis in the steady state. Given the role of residual host tissue DCs in transplant immune reactions, these results suggest that dermal DC homeostasis may contribute to the development of cutaneous graft-versus-host disease in clinical transplantation.


Figures

Figure 1.
Figure 1.
Phenotype of murine dermal DCs. (A) A dermal cell suspension from naive C57BL/6 mice was stained with anti-CD45, CD11c, CD11b, and langerin mAbs and analyzed by flow cytometry. Dot plots show the percentage of dermal CD45+ cells positive for CD11c and CD11b, whereas the overlaid histogram demonstrates that only 10% of dermal CD45+ CD11c+ cells express langerin, likely corresponding to migrating LCs. (B and C) Back skin cross sections isolated from transgenic C57BL/6 mice expressing an enhanced yellow fluorescence protein reporter under the control of the CD11c promoter were stained with anti-langerin mAb. Nuclei were counterstained with DAPI. Image of Cy3 (langerin, red), YFP (CD11c, green), and DAPI (blue) channels show CD11c+ langerin dermal DCs (arrows) and CD11c+ langerin+ LCs (asterisks). Bars, 10 μm. (D) Dermal cell suspensions were prepared as in A. Overlaid histograms show expression levels of I-Ab, CD40, CD86, CD54, F4/80, DEC-205, and DC-SIGN by CD45+ CD11c+ (solid line) and CD45+ CD11c CD11b+ (dotted line) dermal cell subsets.
Figure 2.
Figure 2.
Homeostasis of dermal DCs in quiescent skin. (A and B) Dermal DC turnover in parabiotic mice. Each parabiotic pair consisted of one WT and one GFP+ transgenic mouse (both on a C57BL/6 background) sharing the same blood circulation. Chimerism of blood leukocytes and dermal DCs was analyzed at 6 mo after initiation of parabiosis. Bar graphs show the percentage of GFP+ (black bars) and GFP (white bars) cells among CD45+ langerin CD11c+ dermal DCs, CD45+ langerin CD11c CD11b+ dermal macrophages, and total blood leukocytes in the GFP (A) and GFP+ (B) partner. One representative experiment out of two is shown. (C) A proportion of dermal DCs renews locally in quiescent skin. Back skin cross sections isolated from naive C57BL/6 mice were stained with a mAb against CD11c and the cell cycle protein Ki-67 and counterstained with DAPI. Overlaid images of Cy2 (CD11c, green), Cy3 (Ki-67, red), and DAPI (blue) channels are displayed and show that dermal CD11c+ cells coexpress the cell cycle protein Ki-67 in the dermis. Bars, 10 μm. Bar graph shows the percentage of Ki-67+ cells among total dermal DCs in three separate animals. An average of 150 dermal DCs was analyzed in each skin sample.
Figure 3.
Figure 3.
Homeostasis of dermal DCs after BM transplantation. (A and B) Dermal DC chimerism after congenic BM transplantation. Lethally irradiated 8-wk-old CD45.2+ C57BL/6 mice were reconstituted i.v. with BM cells isolated from congenic CD45.1+ C57BL/6 donor mice. Dermal cell suspensions were isolated at different time points after transplantation and stained with anti-CD45.1, CD45.2, CD11c, CD11b, and langerin antibodies. (A) Dot plot and histogram show the percentage host (CD45.2+) dermal DCs among total CD11c+ langerin dermal DCs. (B) Bar graphs show the percentage of host CD45.2+ dermal CD11c+ (black bars) and CD11c CD11b+ (white bars) cells in the dermis of chimeric mice at 1, 3, and 13 mo after BM transplantation. Results represent the mean of four independent experiments. (C) Residual host dermal DCs renew in the skin after BM transplantation. CD45.2+ mice were lethally irradiated and reconstituted with CD45.1+ BM cells. 6 wk after BM transplantation, chimeric mice received BrdU in their drinking water for 3 wk. Graphs show the percentage BrdU+ cells among gated donor CD45.1+ CD11c+ and host CD45.2+ CD11c+ cells in chimeric animals at different time points after BrdU administration. Each data point summarizes the results of three independent experiments.
Figure 4.
Figure 4.
Homeostasis of dermal DCs in inflamed skin. (A and B) UV-induced inflammatory changes in the skin. Backs of C57BL/6 mice were shaved (1cm2) and exposed to UV light. 4 d later, mice were killed to isolate the shaved back skin. (A) Hematoxylin and eosin–stained skin cross sections show large inflammatory infiltrates in mice exposed to UV light 4 d earlier (bottom) compared with unexposed skin (top). Bars, 100 μm. (B) Back skin cross sections (shown in A) were stained with anti-CCL2 mAb. Nuclei were counterstained with DAPI. Overlaid image of Cy3 (CCL2, red) and DAPI (blue) channels is displayed. Bars, 10 μm. (C and D) Exposure to UV light eliminates skin-resident dermal DCs. C57BL/6 CD45.2+ mice were lethally irradiated and reconstituted with CD45.1+ BM. 1 mo after BM transplantation, mice were exposed to UV light or left untreated. (C and D) Dot plots (C) and bar graph (D) show the percentage of host (CD45.2+) or donor (CD45.1+) cells among total CD11c+ dermal DCs in control animals or 6 wk after exposure to UV light. One representative experiment out of five is shown in C. In D, each bar is the result of five independent experiments.
Figure 5.
Figure 5.
Repopulation of dermal DCs in inflamed skin depends on CCR2, but not CCR6. C57BL/6 CD45.1+ mice were lethally irradiated and reconstituted with a 1:1 mixture of CD45.1+ WT BM and CD45.2+ BM cells isolated from WT animals or animals lacking CCR2 (CCR2−/−), CCR6 (CCR6−/−), or both CCR2 and CCR6 (CCR2/6−/−) as described in Materials and methods. 1 mo after BM transplantation, chimeric mice were exposed to UV light. Bar graphs show the percentage of WT CD45.1+ (white bars) and WT, CCR2−/−, CCR6−/−, or CCR2/CCR6−/− CD45.2+ cells (black bars) among total CD11c+ dermal DCs (A) and epidermal MHC class II+ LCs (B) 3 wk after UV exposure. Each bar summarizes the results of three independent experiments. (A) *, P = 0.0009; **, P = 0.009; (B) *, P = 0.00001; **, P = 0.0002; ***, P = 0.00007.
Figure 6.
Figure 6.
Human dermal DCs proliferate in situ. Cross sections of paraffin-embedded normal human skin obtained from cadavers were stained with anti–Factor XIIIa and anti–Ki-67 mAbs as described in Materials and methods. Nuclei were counterstained with DAPI. (A) Overlaid images of Cy2 (Factor XIIIa, green), Cy3 (Ki-67, red), and DAPI (blue) channels are displayed. Bars, 10 μm. (B) A dot graph shows the percentage of Factor XIIIa/ Ki-67 double positive cells among total dermal Factor XIIIa+ cells in five separate donors. In each skin sample, an average of 600 Factor XIIIa+ cells was analyzed.
Figure 7.
Figure 7.
The fate of human dermal DCs after allo-HCT. Noninflamed skin samples were obtained from patients who underwent reduced intensity (n = 4) or myeloablative conditioning (n = 1) for allo-HCT and did not develop GVHD (see Table I) (A–C). GVHD-affected skin samples were isolated from four patients who underwent myeloablative conditioning for allo-HCT (see Table II) and developed GVHD (D and E). (A) Cross sections of 2-mm skin biopsies obtained 1 mo after allo-HCT were stained with X (Cy3) and Y (Cy2) DNA probes, followed by staining with anti-langerin (Cy3) and HLA-DR (Cy5) antibodies and DAPI as described in Materials and methods. A representative image obtained from a female recipient injected with male hematopoietic cells is shown. Overlaid images of three out of four color channels in indicated combinations (HLA-DR, Y, and DAPI on the left, and X, Y, and DAPI on the right) show persistence of residual host XX+ HLA-DR+ langerin cell dermal DCs. Langerin+ cells (asterisks) were excluded from the analysis. A female cell (XX; open arrow) and a male cell (XY; stealth arrow) are shown. Bars, 10 μm. (B) Dermal DC chimerism after allo-HCT in noninflamed skin. Dot graphs show the percentage of residual host cells among dermal DCs and total BM nucleated cells in each patient 30 d after allo-HCT. (C and E) CCL2 is highly up-regulated in GVHD-affected skin. Noninflamed skin from patient 1 (Table I) (C) and GVHD-affected skin from patient 1 (Table II) (D) were stained with anti–human CCL-2 mAb (Cy3). Nuclei were counterstained with DAPI. Overlaid images of Cy3 (CCL-2, red) and DAPI (blue) channels are displayed. Displayed images represent MCP-1 expression in one out of five samples in each patient group. Bars, 100 μm. (E) Dermal DC chimerism in GVHD-affected skin. Dot graph shows the percentage of remaining host dermal DCs and BM nucleated cells in patients who developed GVHD.

References

    1. Valladeau, J., and S. Saeland. 2005. Cutaneous dendritic cells. Semin. Immunol. 17:273–283. - PubMed
    1. Schuler, G., F. Koch, C. Heufler, E. Kampgen, G. Topar, and N. Romani. 1993. Murine epidermal Langerhans cells as a model to study tissue dendritic cells. Adv. Exp. Med. Biol. 329:243–249. - PubMed
    1. Cerio, R., C.E. Griffiths, K.D. Cooper, B.J. Nickoloff, and J.T. Headington. 1989. Characterization of factor XIIIa positive dermal dendritic cells in normal and inflamed skin. Br. J. Dermatol. 121:421–431. - PubMed
    1. Nestle, F.O., L.A. Turka, and B.J. Nickoloff. 1994. Characterization of dermal dendritic cells in psoriasis. Autostimulation of T lymphocytes and induction of Th1 type cytokines. J. Clin. Invest. 94:202–209. - PMC - PubMed
    1. Lenz, A., M. Heine, G. Schuler, and N. Romani. 1993. Human and murine dermis contain dendritic cells. Isolation by means of a novel method and phenotypical and functional characterization. J. Clin. Invest. 92:2587–2596. - PMC - PubMed

Publication types

MeSH terms