. 2006 Nov 27;203(12):2749-61.
doi: 10.1084/jem.20060710. Epub 2006 Nov 20.

Random migration precedes stable target cell interactions of tumor-infiltrating T cells

Affiliations

Random migration precedes stable target cell interactions of tumor-infiltrating T cells

Paulus Mrass et al. J Exp Med. .

Abstract

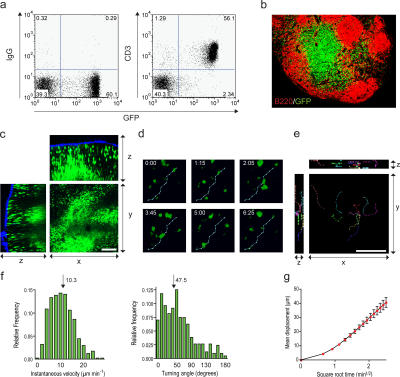
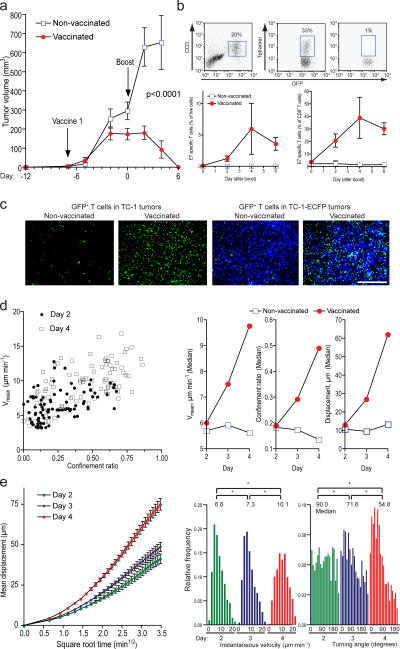
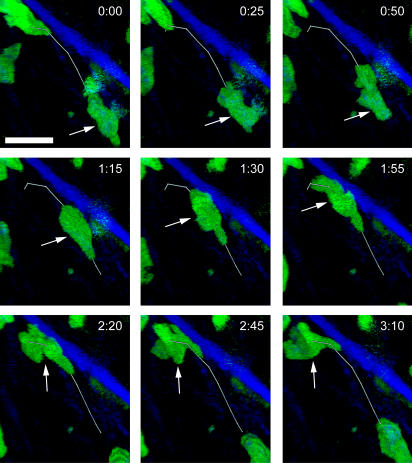
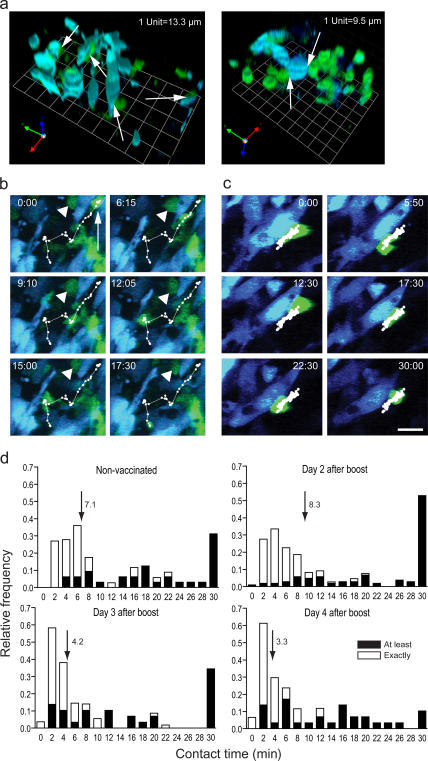
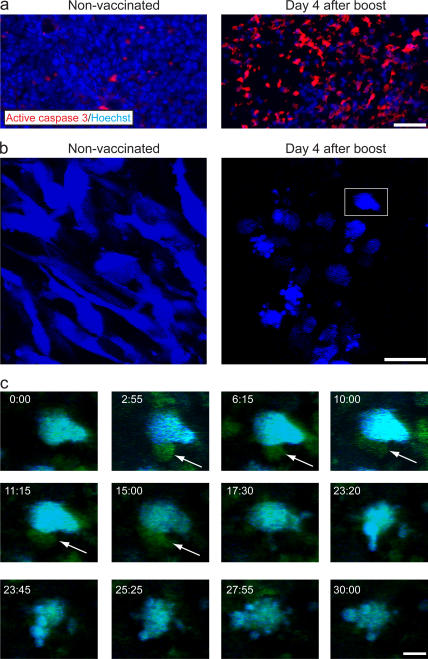
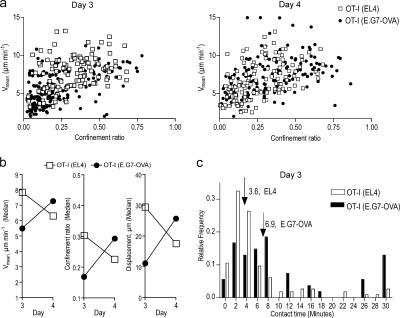
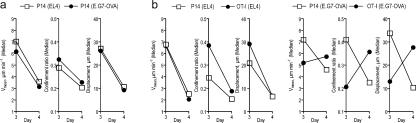
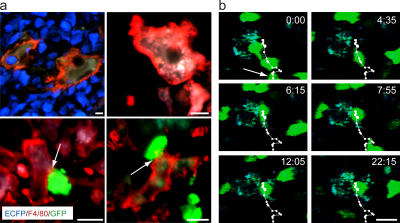
The tumor microenvironment is composed of an intricate mixture of tumor and host-derived cells that engage in a continuous interplay. T cells are particularly important in this context as they may recognize tumor-associated antigens and induce tumor regression. However, the precise identity of cells targeted by tumor-infiltrating T lymphocytes (TILs) as well as the kinetics and anatomy of TIL-target cell interactions within tumors are incompletely understood. Furthermore, the spatiotemporal conditions of TIL locomotion through the tumor stroma, as a prerequisite for establishing contact with target cells, have not been analyzed. These shortcomings limit the rational design of immunotherapeutic strategies that aim to overcome tumor-immune evasion. We have used two-photon microscopy to determine, in a dynamic manner, the requirements leading to tumor regression by TILs. Key observations were that TILs migrated randomly throughout the tumor microenvironment and that, in the absence of cognate antigen, they were incapable of sustaining active migration. Furthermore, TILs in regressing tumors formed long-lasting (>or=30 min), cognate antigen-dependent contacts with tumor cells. Finally, TILs physically interacted with macrophages, suggesting tumor antigen cross-presentation by these cells. Our results demonstrate that recognition of cognate antigen within tumors is a critical determinant of optimal TIL migration and target cell interactions, and argue against TIL guidance by long-range chemokine gradients.


Figures

Figure 1.
Figure 1.
Migratory behavior of endogenous T cells within explanted PLNs. (a) Single cell suspensions of pooled PLNs from 4-mo-old DPEGFP mice were stained using isotype control or anti-CD3 mAbs. Gates were set on viable cells. (b) Frozen sections of a DPEGFP PLN were immunostained for B220 (red). (c) An inguinal LN from a DPEGFP mouse was explanted, and GFP+ cells were visualized by two-photon microscopy as described in Materials and methods, with the exception that x-y planes were 584 by 584 μm (resolution, 1.14 μm pixel−1) and the step size was 4 μm. GFP+ T cells (green) were covisualized with ECM fibers (second harmonic generation; blue). Bar, 100 μm. (d) A representative track of a migrating T cell is shown. The numbers indicate minutes/seconds. (e) Representative tracks of an analyzed region are shown. Bar, 100 μm. (f) The instantaneous velocities and turning angles of the T cell tracks were calculated. The relative frequencies of these parameters are charted. The arrows indicate the median values of each measurement. (g) The mean displacement is charted versus the square root of time.
Figure 2.
Figure 2.
T cells migrate randomly within explanted tumors and become highly motile during tumor regression. (a) The tumor volume was measured in control and vaccinated animals for up to 19 d. (b) Single cell suspensions of tumors were analyzed for the presence of E7-specific CD8+ T cells using MHC class I tetramers. A representative FACS profile is shown in the top panel. The percentage of E7-specific cells within total live cells or CD8+ T cells was determined in a time course (bottom panels). (c) Sections of formalin-fixed TC-1 and TC1-ECFP (blue) tumors were analyzed with immunofluorescence microscopy for the presence and distribution of GFP+ cells (green). Bar, 200 μm. (d) Two-photon imaging was used to track and measure migratory characteristics of GFP+ T cells within explanted tumors (correlation between Vmean and confinement ratio: day 2: r = 0.48, P < 0.0001; day 4: r = 0.55, P < 0.0001). See Table I for statistical analysis of migratory parameters. (e) Mean displacement plots (left) and the relative frequency distribution of instantaneous velocities and turning angles (right) of nonconfined T cells in vaccinated animals are depicted (*, P < 0.001).
Figure 3.
Figure 3.
Migrating TILs reveal a polarized morphology and crawl along fibers of the ECM. A TC-1 tumor was explanted on day 4 after the vaccine boost, and T cells (green) and ECM fibers (blue; second harmonic generation signals) were visualized by two-photon microscopy. Imaging was performed as described in Materials and methods, except that x-y planes were 67.5 by 67.5 μm with 0.13 μm pixel−1. Note the formation of lamellipodia at the leading edge and the uropod at the trailing end of the cells. One individual cell is followed over time (indicated by arrow and track). Numbers indicate minutes/seconds. Bar, 12 μm.
Figure 4.
Figure 4.
TILs engage in short- and long-term interactions with tumor cells in explanted tumors. GFP+ T cells (green) and TC-1-ECFP tumor cells (blue) were imaged simultaneously with two-photon microscopy. (a) Three-dimensional reconstruction of areas containing T cell–tumor cell contacts (arrows) 2 (left) and 3 (right) d after the vaccine boost. (b) A T cell undergoing a stable interaction (arrowhead) with a tumor cell and a T cell interacting sequentially (arrow, track) with several tumor cells are shown. (c) A T cell crawling along the surface of a tumor cell is depicted (track). Numbers in a and b indicate minutes/seconds. Bar, 13 μm. (d) The contact times of T cells interacting with tumor cells are charted. Open bars, conjugates that were tracked for the entire observation period; filled bars, conjugates that were present either at the beginning or at the end of the observation period (nonvaccinated: n = 69 interactions; day 2 after boost: n = 221 interactions; day 3 after boost: n = 83 interactions; day 4 after boost: n = 90 interactions). Arrows and numbers depict the median interaction times.
Figure 5.
Figure 5.
Contact with T cells precedes initiation of apoptosis in tumor cells. (a) On day 4 after vaccination, tissue sections were stained with an antibody against active caspase 3 (red) and cell nuclei were stained with Hoechst 33258 (blue). Bar, 100 μm. (b) Explanted TC-1 ECFP tumors were imaged with two-photon microscopy. Bar, 26 μm. (c) The boxed tumor cell in b was followed in detail for 30 min. The tumor cell was contacted by a T cell (green, arrow) before it disintegrated. Numbers indicate minutes/seconds. Bar, 9 μm.
Figure 6.
Figure 6.
Tumor antigen–specific T cells engage in direct contact with tumor cells and maintain high motility in the presence of cognate antigen. (a) DPEGFPxOT-I CTLs were tracked in explanted EL4 and EG.7-OVA tumors using two-photon microscopy, and their migratory parameters were measured (correlation between Vmean and confinement ratio: EL4, day 3: r = 0.38, P < 0.0001; EG.7-OVA, day 3: r = 0.52, P < 0.0001; EL4, day 4: r = 0.55, P < 0.0001; E.G7-OVA, day 4: r = 0.54, P < 0.0001). (b) Shown are the dynamic changes in migratory parameters between days 3 and 4 after adoptive transfer. See Table II for statistical analysis. (c) The duration of interactions between DPEGFPxOT-I CTL and E.G7-OVA-ECFP or EL4-ECFP tumor cells was measured. The relative frequencies of contact times are charted (EL4: n = 114 interactions; E.G7-OVA: n = 54 interactions; P = 0.0005 determined by Mann-Whitney test). Arrows and numbers depict the median interaction times.
Figure 7.
Figure 7.
Recognition of cognate antigen is necessary to sustain motility of TILs. (a) Effector CTLs generated from DPEGFPxP14 mice were transferred together with unlabeled OT-I effector CTLs into EL4 or E.G7-OVA tumor-bearing animals. Imaging was performed 3 and 4 d later, and migratory characteristics were determined. See Table S1 for statistical analysis. (b) P14-EYFP and OT-I-ECFP CTL were cotransferred into mice carrying EL4 or E.G7-OVA tumors. 3 and 4 d later, cells were simultaneously visualized in the same fields of view and migratory characteristics were determined. See Tables S2 and S3 for statistical analysis.
Figure 8.
Figure 8.
Tumor antigen–specific T cells engage in physical contact with macrophages in explanted tumors. (a) E.G7-OVA-ECFP tumors were analyzed by immunofluorescence microscopy 4 d after adoptive transfer of DPEGFPxOT-I CTL. F4/80+ cells (red) contained autofluorescent particulate material. Contacts between T cells (green) and F4/80+ cells are depicted by arrows. Bars, 10 μm. (b) Two-photon imaging shows a crawling T cell (green) that arrests after contacting a macrophage (cyan) within explanted E.G7-OVA-ECFP tumors. The arresting T cell is highlighted with an arrow and a track. Numbers indicate minutes/seconds. Bar, 13 μm.
Figure 9.
Figure 9.
Migratory characteristics of OT-I effector CTLs within EL4 tumors in vivo. EL4 cells were injected subcutaneously into the flanks of C57BL/6 mice. DPEGFPxOT-I effector CTLs were adoptively transferred 8 or 9 d later. After an additional 3 d, two-photon imaging was performed in surgically exposed tumors (n = 4) of anesthetized mice. (a) Migratory parameters were determined (circles) and are shown in comparison to data obtained in tumor explants (quadrangles). For both conditions, 21 consecutive video frames were analyzed (Vmean [median]: in vivo: 7.7 μm min−1, explants: 8.1 μm min−1; P = 0.33; confinement ratio [median]: in vivo: 0.37, explants: 0.39; P = 0.91). (b) The mean displacement of nonconfined cells (Vmean ≥ 5 μm min−1, confinement ratio ≥ 0.5) within explanted tumor tissue or in vivo was calculated and charted over time.

References

    1. Dunn, G.P., L.J. Old, and R.D. Schreiber. 2004. The three Es of cancer immunoediting. Annu. Rev. Immunol. 22:329–360. - PubMed
    1. Jager, E., D. Jager, and A. Knuth. 2003. Antigen-specific immunotherapy and cancer vaccines. Int. J. Cancer. 106:817–820. - PubMed
    1. Ho, W.Y., J.N. Blattman, M.L. Dossett, C. Yee, and P.D. Greenberg. 2003. Adoptive immunotherapy: engineering T cell responses as biologic weapons for tumor mass destruction. Cancer Cell. 3:431–437. - PubMed
    1. Sadelain, M., I. Riviere, and R. Brentjens. 2003. Targeting tumours with genetically enhanced T lymphocytes. Nat. Rev. Cancer. 3:35–45. - PubMed
    1. Schuler, G., B. Schuler-Thurner, and R.M. Steinman. 2003. The use of dendritic cells in cancer immunotherapy. Curr. Opin. Immunol. 15:138–147. - PubMed

Publication types