Comparative Study
. 2006 Dec 5;103(49):18860-5.
doi: 10.1073/pnas.0608571103. Epub 2006 Nov 20.

Power spectra reveal the influence of stochasticity on nonlinear population dynamics

Affiliations
Comparative Study

Power spectra reveal the influence of stochasticity on nonlinear population dynamics

Daniel C Reuman et al. Proc Natl Acad Sci U S A. .

Abstract

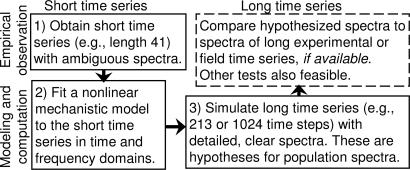
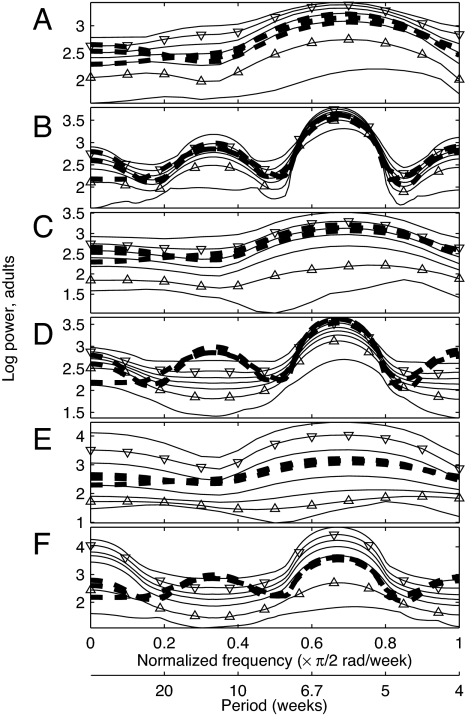
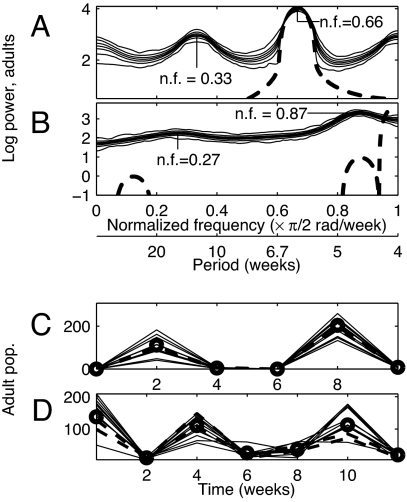
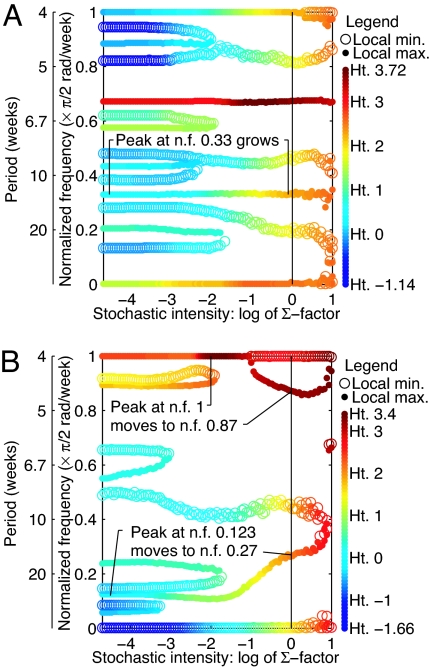
Stochasticity alters the nonlinear dynamics of inherently cycling populations. The power spectrum can describe and explain the impacts of stochasticity. We fitted models to short observed time series of flour beetle populations in the frequency domain, then used a well fitting stochastic mechanistic model to generate detailed predictions of population spectra. Some predicted spectral peaks represent periodic phenomena induced or modified by stochasticity and were experimentally confirmed. For one experimental treatment, linearization theory explained that these peaks represent overcompensatory decay of deviations from deterministic oscillation. In another treatment, stochasticity caused frequent directional phase shifting around a cyclic attractor. This directional phase shifting was not explained by linearization theory and modified the periodicity of the system. If field systems exhibit directional phase shifting, then changing the intensity of demographic or environmental noise while holding constant the structure of the noise can change the main frequency of population fluctuations.


Conflict of interest statement

The authors declare no conflict of interest.

Figures

Fig. 1.
Fig. 1.
The new “spectrum enhancement method” (boxes 1–3, for the three steps of the method) and one way of testing predictions of the method using spectra of long observed time series (fourth box). The method uses biological information contained in a model's functional form to magnify the resolution of predicted spectral estimates. Using this method, the LSD-LPA model accurately magnified spectral resolution; models with incorrect functional forms made incorrect spectral predictions (text). Detailed spectral predictions of well tested models provide biological understanding; predictions of less well tested models provide testable hypotheses.
Fig. 2.
Fig. 2.
Frequency domain fits between models and observed adult population time series of length 41 (A, C, and E) and length 213 (B, D, and F) from the three experimental replicates with cpa = 0.35. The heavy dashed lines are data log spectra, identical in A, C, and E and identical in B, D, and F. Light solid lines give the minimum, the 5th, 25th, 50th, 75th, and 95th percentiles, and the maximum values at each frequency value of 1,000 log spectra of model-generated time series of length 41 (A, C, and E) and length 213 (B, D, and F). Triangles highlight the 5th and 95th percentiles. Models used were the LSD-LPA model with parameters of Supporting Text 1.1 (A and B), the (intentionally incorrect) constrained LSD-LPA model with cel = 0 and time-domain-optimized parameters of Supporting Text 2.2 (C and D), and the (intentionally incorrect) constrained LSD-LPA model with cea = 0 and time-domain-optimized parameters of Supporting Text 2.2 (E and F). All parameters were optimized for length-41 data. Contrast the good fit in B with the poor fits in D and F. Fit of the constrained LSD-LPA model with no further constraint is similar to A and B and is shown in Supporting Text 2.2. Fits were similar when frequency-domain optimized parameters were used (Supporting Text 2.2). Aliasing of fundamental frequencies of population fluctuation is unlikely to have occurred because the biology of Tribolium suggests that little fluctuation occurs for normalized frequency (nf) >1.
Fig. 3.
Fig. 3.
Model-predicted power spectra (A and B) and experimental support for predictions (C and D). LSD-LPA model-predicted peaks for cpa = 0.5 (A) and cpa = 0 (B) correspond to period 6 time steps (nf 0.33) (A) and period ≈7.4 time steps (nf 0.27) (B). Thin solid lines in A and B give the minimum, 5th, 25th, 50th, 75th, and 95th percentiles, and maximum values at each frequency of 1,000 log spectra of LSD-LPA model-generated adult time series of length 1024. Thick dashed lines give spectra of time series generated by the LPA model with initial conditions on the model attractor. Dashed lines extend below figure axes, but show no important features there. (C) Thin solid lines give 10 repetitions of a length-6 repeating pattern randomly chosen from 129 repetitions isolated from typical length-1024 output of the LSD-LPA model with cpa = 0.5. Centers of heavy circles are medians of all 129 repetitions. The median pattern was present in experimental data; the best repetition detected in each of the three replicates is shown with a thick dashed line. The pattern caused the smaller LSD-LPA model peak (at nf 0.33) in A. (D) Thin solid lines give 10 repetitions of a length-7 repeating pattern isolated from typical length-1024 output of the LSD-LPA model with cpa = 0. Centers of heavy circles are medians of these values. The median pattern was detected in data (thick dashed lines). The pattern caused the smaller LSD-LPA model peak (at nf 0.27) in B.
Fig. 4.
Fig. 4.
Spectral peaks and valleys with increasing intensity of stochasticity in the SD-LPA model for the adult life-stage with cpa = 0.5 (A) and cpa = 0 (B). Vertical axes show frequencies of local maxima (filled circles) and minima (open circles) of log spectra. Color shows the heights (Ht.) of local maxima and minima. Horizontal axis shows intensity of stochasticity (scalar multiple of noise covariance matrix; see Methods). Under very low stochasticity (left), spectra were those of the deterministic model. Vertical black lines show experimental stochasticity (Σ factor 1). For these parameter values and Σ factor 1, LSD-LPA, and SD-LPA model spectral predictions were very similar: lattice effects were small. Stochasticity explains the locations of peaks for the LSD-LPA model (Fig. 3 A and B) by explaining the locations of peaks for the SD-LPA model. The smaller peak in Fig. 3A was induced by stochasticity. The smaller peak of Fig. 3B (nf = 0.27) was the nf = 0.123 peak of the LPA model, shifted by stochasticity (and not further shifted by lattice effects). The main peak of Fig. 3B (nf = 0.87) did not come from the deterministic model peak at nf = 0.877, as was expected before this analysis, but was the nf = 1 deterministic model peak, shifted by stochasticity (and not further changed by lattice effects). The deterministic model peak at nf = 0.877 was eliminated by stochasticity. Supporting Text 2.3 shows other life stages. No statistical confidence intervals are given for the locations or heights of peaks and valleys because the variability in these quantities is expected to be small (Supporting Text 1.6 has details of how plots were produced) and no probabilistic conclusions were drawn.

Comment in

References

    1. Bjørnstad ON, Grenfell BT. Science. 2001;293:368–643. - PubMed
    1. Drake JM, Lodge DM. Ecol Lett. 2004;7:26–30.
    1. Sæther B-E, Engen S. Trends Ecol Evol. 2004;19:351–353. - PubMed
    1. Bartlett MS. J R Stat Soc. 1957;120:48–60.
    1. Higgins K, Hastings A, Sarvela JN, Botsford LW. Science. 1997;276:1431–1435.

Publication types