. 2006 Dec 5;103(49):18609-14.
doi: 10.1073/pnas.0604844103. Epub 2006 Nov 20.

Two isoforms of tissue transglutaminase mediate opposing cellular fates

Affiliations

Two isoforms of tissue transglutaminase mediate opposing cellular fates

Marc A Antonyak et al. Proc Natl Acad Sci U S A. .

Abstract

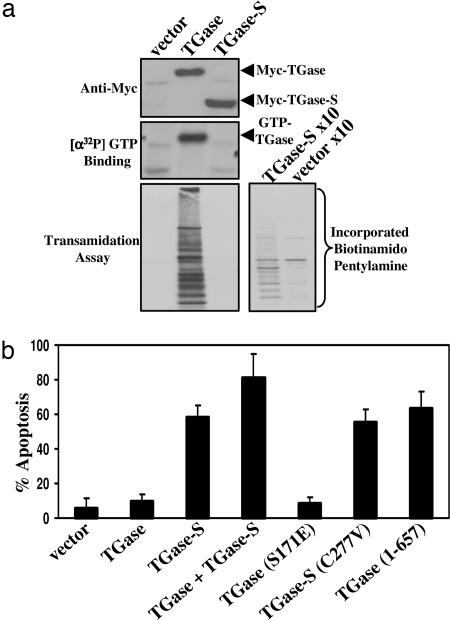
Opposing cellular responses are typically regulated by distinct sets of genes. However, tissue transglutaminase (TGase) provides an interesting example of a single gene product that has been implicated both in affording protection against cellular insults as well as in promoting cell death. Here, we shed some light on how these conflicting activities might be manifested by demonstrating that alternative transcripts of TGase differentially affect cell viability. We show that although the full-length TGase protein affords strong protection against cell death signals, a shorter version of TGase that is truncated at the 3' end, and thus called TGase-short (TGase-S), is cytotoxic. The apoptotic activity of TGase-S is not dependent on its transamidation activity because the mutation of a cysteine residue that is essential for catalyzing this reaction does not compromise the ability of TGase-S to induce cell death. Intriguingly, TGase-S undergoes inappropriate oligomer formation in cells before cell death, suggesting a novel mechanism for the apoptotic effects of this protein.


Conflict of interest statement

The authors declare no conflict of interest.

Figures

Fig. 1.
Fig. 1.
TGase and TGase-S differently impact cell viability. (a) Schematic diagram of the functional domains of TGase (Upper) and TGase-S (Lower). The numbers refer to amino acid residues. (b) Myc-TGase or Myc-TGase-S was expressed in NIH 3T3 cells for various times and then lysed. The cell lysates were immunoblotted as indicated. (c) NIH 3T3 cells transiently expressing Myc-TGase or Myc-TGase-S were maintained in medium with or without 5% serum for 1 day and then fixed. Immunofluorescence was performed on the samples by using Myc antibody and DAPI to detect transfectants and nuclei, respectively (Inset). Cells cultured with (open bars) or without (filled bars) serum were scored for cell death as identified by nuclear condensation/blebbing and graphed. (d) SKBR3 cells expressing Myc-TGase or Myc-TGase-S for 2 days were assayed for cell death as outlined in c.
Fig. 2.
Fig. 2.
TNFα-induced TGase-S expression promotes cell death. (a) NIH 3T3 cells were treated with 5 μM RA, 35 ng/ml TNFα, or 0.2 μM doxorubicin (Dox) for 1 or 2 days and then lysed. The cell lysates were immunoblotted as indicated. Note the presence of a larger TGase species of ≈180 kDa (TGase-S oligomer) in lysates from cells treated with TNFα or doxorubicin. (b and c) Cells transfected with TGase-RNAi-1 or -2 were treated with 5 μM RA or 35 ng/ml TNFα for 1 day and then either lysed or fixed. (b) The lysed cells were immunoblotted as indicated. (c) The fixed cells were stained with DAPI and then scored for cell death as identified by nuclear condensation/blebbing.
Fig. 3.
Fig. 3.
TGase-S-induced cell death does not require its transamidation activity. (a) Lysates from Cos7 cells expressing Myc-TGase or Myc-TGase-S were immunoblotted as indicated. The GTP-binding activities of Myc-TGase and Myc-TGase-S were determined by using an affinity-labeling assay with [α-32P]GTP. Shown is an autoradiogram of the results. The transamidation activities of the TGase isoforms were determined from the same cell lysates by assaying the incorporation of 5-(biotinamido)pentylamine into proteins. Shown are the results from an experiment where 7.5 or 75 μg (x10) of the indicated cell lysates were assayed. (b) NIH 3T3 cells expressing the indicated TGase and TGase-S constructs for 1.5 days were fixed and subjected to immunofluorescence with Myc antibody and DAPI. Transfectants were scored for cell death as identified by nuclear condensation/blebbing.
Fig. 4.
Fig. 4.
TGase-S oligomerizes in cells. Myc-tagged TGase, TGase-S, TGase (1–657), and TGase-S (C277V) were expressed in Cos7 cells and then lysed. (a) The cell lysates were immunoblotted as indicated. Note the presence of larger Myc-TGase-S and Myc-TGase (1–657) species of ≈180–240 kDa [Myc-TGase-S and TGase (1–657) Oligomers]. The GTP-binding activities of the various constructs were determined by using an affinity-labeling assay with [α-32P]GTP. Shown is an autoradiogram of the assay. (b) The indicated cell lysates were immunoblotted with TGase and actin antibodies. The larger Myc-TGase-S species detected is denoted as “TGase-S Oligomers.”
Fig. 5.
Fig. 5.
TGase-S forms large aggregates in cells. About 12 h after the transfection of NIH 3T3 cells with the indicated TGase and TGase-S constructs, the cells were fixed. (a) Immunofluorescence was performed on the samples by using Myc antibody. The top and side views of the transfectants are shown. (b) Immunofluorescence was also performed on samples by using Myc and β-COP antibodies and DAPI to detect transfectants, Golgi, and nuclei, respectively.
Fig. 6.
Fig. 6.
TGase and TGase-S exhibit distinct biochemical properties. Lysates of Cos7 cells expressing Myc-TGase or Myc-TGase-S were separated by SDS/PAGE (a) or native-PAGE (b) and immunoblotted as indicated. (c) The cell extracts were also loaded onto a Superdex 200 gel filtration column and eluted from the column in 1.0-ml fractions. Aliquots (50 μl) from each fraction (indicated by numbers) were immunoblotted with Myc antibody. The elution profiles of Myc-TGase-S (Upper) and Myc-TGase (Lower) are shown. Fractions 15–21 correspond to a molecular mass range from 580–500 kDa, whereas fractions 28–35 correspond to a molecular mass range from 220–140 kDa.

References

    1. Griffin M, Casadio R, Bergamini CM. Biochem J. 2002;368:377–396. - PMC - PubMed
    1. Lorand L, Graham RM. Nat Rev Mol Cell Biol. 2003;4:140–156. - PubMed
    1. Fesus L, Szondy Z. FEBS Lett. 2005;579:3297–3302. - PubMed
    1. Antonyak MA, Miller AM, Jansen JM, Boehm JE, Balkman CE, Wakshlag JJ, Page RL, Cerione RA. J Biol Chem. 2004;279:41461–41467. - PubMed
    1. Lesort M, Chun W, Johnson GV, Ferrante RJ. J Neurochem. 1999;73:2018–2027. - PubMed

Publication types

LinkOut - more resources