. 2006 Nov 28;103(48):18131-6.
doi: 10.1073/pnas.0606428103. Epub 2006 Nov 20.

A physical linkage between cystic fibrosis airway surface dehydration and Pseudomonas aeruginosa biofilms

Affiliations

A physical linkage between cystic fibrosis airway surface dehydration and Pseudomonas aeruginosa biofilms

Hirotoshi Matsui et al. Proc Natl Acad Sci U S A. .

Abstract

A vexing problem in cystic fibrosis (CF) pathogenesis has been to explain the high prevalence of Pseudomonas aeruginosa biofilms in CF airways. We speculated that airway surface liquid (ASL) hyperabsorption generates a concentrated airway mucus that interacts with P. aeruginosa to promote biofilms. To model CF vs. normal airway infections, normal (2.5% solids) and CF-like concentrated (8% solids) mucus were prepared, placed in flat chambers, and infected with an approximately 5 x 10(3) strain PAO1 P. aeruginosa. Although bacteria grew to 10(10) cfu/ml in both mucus concentrations, macrocolony formation was detected only in the CF-like (8% solids) mucus. Biophysical and functional measurements revealed that concentrated mucus exhibited properties that restrict bacterial motility and small molecule diffusion, resulting in high local bacterial densities with high autoinducer concentrations. These properties also rendered secondary forms of antimicrobial defense, e.g., lactoferrin, ineffective in preventing biofilm formation in a CF-like mucus environment. These data link airway surface liquid hyperabsorption to the high incidence of P. aeruginosa biofilms in CF via changes in the hydration-dependent physical-chemical properties of mucus and suggest that the thickened mucus gel model will be useful to develop therapies of P. aeruginosa biofilms in CF airways.


Conflict of interest statement

The authors declare no conflict of interest.

Figures
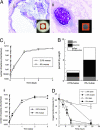
Fig. 1.
Fig. 1.
Growth of P. aeruginosa strain PAO1 in model systems for mucus plaques and plugs in CF airways. (A) Bacterial culture chambers mimicking mucus plaques and plugs of CF airways. (i) Plaque of thickened mucus covering a CF airway surface was mimicked with mucus placed in a 1-mm-deep plastic chamber in a humidified Petri dish, open to oxygen supply from the lumen (inset). (ii) Mucus plugs in CF airways were mimicked with mucus placed in a 1- mm-deep chamber with a plastic lid sealing the top to limit oxygen supply (inset). (B) Composition of 2.5% and 8% mucus samples. Mucin concentration was measured in normal (2.5% solids) and CF-like (8% solids) mucus by differential refractometry. Other molecules are defined as DNA, cellular debris, and other proteins [unpublished data from the Sheehan laboratory (University of North Carolina)]. (C) Bacterial growth curve in normal and CF-like mucus. Approximately 5 × 10³ P. aeruginosa (PAO1) were deposited onto 2.5% and 8% solid mucus in open (i) and closed (ii) chambers. Bacterial number was counted at 0, 6, 24, 48, and 72 h; n = 3. (D) Oxygen partial pressure of P. aeruginosa-infected mucus. Oxygen partial pressure was measured at the bottom of bacterial cultures with oxygen-sensitive fluorescent probe; n = 5.
Fig. 2.
Fig. 2.
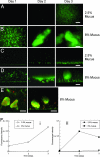
P. aeruginosa macrocolony formation in mucus. (AD) Bacteria GFP-PAO1 (≈5 × 10³) were deposited into mucus of 2.5% solids (A and C) and 8% solids (B and D) placed in open chambers and photographed on days 1, 2, and 3 by epifluorescence (A and B) (×10 objective) and x–z confocal (C and D) (×40 objective) microscopy. (Scale bars = 200 μm in A and C and 50 μm in B and D.) Representative of n = 10 experiments. (E) Live and dead staining of P. aeruginosa macrocolonies. Pseudomonas macrocolonies in 8% mucus were photographed with x–y (i) and x–z (ii) scanning by confocal microscopy (green = GFP, red propidium iodide). (Scale bar = 50 μm.) (F) Quantitation of macrocolony size. Macrocolony size was expressed as the total fluorescence intensity of a single macrocolony, reflecting the number of bacteria forming a macrocolony. (i) open chamber, (ii) closed chamber; n = 3.
Fig. 3.
Fig. 3.
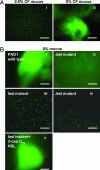
Variables influencing macrocolony development in mucus. (A) P. aeruginosa macrocolony formation in CF mucus. GFP-PAO1 (≈5 × 10³ cfu) deposited in CF mucus exhibited macrocolony formation in 8% mucus (ii) but not in 2.5% mucus (i) 48 h after inoculation. (Scale bar = 200 μm.) (B) Effects of lasI gene mutation. Wild-type PAO1 (i) but not lasI mutants (ii) developed macrocolonies 48 h after inoculation with ≈5 × 10³ bacteria. (Scale bar = 200 μm.) x–y (iii) and x–z (iv) scanning by confocal microscopy detected homogeneous distribution of planktonic single bacteria (lasI mutant) within mucus of 8% solids. (Scale bar = 50 μm.) The defective macrocolony formation was rescued by addition of 10 μM 3-oxo C12 HSL (v). (Scale bar = 200 μm.)
Fig. 4.
Fig. 4.
Mechanisms of macrocolony development. (A) Mean squared displacement of 1-μm beads in 2.5% and 8% mucus. (B) Mean squared displacement times radius of 200-nm, 1-μm, and 3-μm beads in 2.5% and 8% mucus. (C) P. aeruginosa motility in mucus of 2.5% and 8% solids. (D) Diffusion of 3-oxo C12 HSL in 2.5% vs. 8% mucus; n = 6.
Fig. 5.
Fig. 5.
Absence of effects of lactoferrin on P. aeruginosa macrocolony development in 8% mucus. Mucus was infected with ≈5 × 10³ PAO1 as above, and images were obtained by fluorescence microscopy 48 h later. (A) Low-iron mucus control. (B) Low-iron mucus with 10 mg/ml lactoferrin. (C) Low-iron mucus with 10 mg/ml conalbumin. (Scale bar = 200 μm.) (D) Diffusion of fluorescently labeled lactoferrin in mucus. Fluorescence intensity ratio between highest and lowest regions in 2.5% vs. 8% mucus after lactoferrin deposition as a point source was measured at 0, 3, 18, 24, and 48 h; n = 3.

Similar articles

Cited by

References

    1. Matsui H, Grubb BR, Tarran R, Randell SH, Gatzy JT, Davis CW, Boucher RC. Cell. 1998;95:1005–1015. - PubMed
    1. Pedersen SS. APMIS Suppl. 1992;28:1–79. - PubMed
    1. Christensen BB, Sternberg C, Andersen JB, Palmer RJ, Nielsen AT, Givskov M, Molin S. In: Biofilms. Abelson JN, Simon MI, editors. Vol 310. San Diego: Academic; 1999. pp. 20–42. - PubMed
    1. Davies DG, Parsek MR, Pearson JP, Iglewski BH, Costerton JW, Greenberg EP. Science. 1998;280:295–298. - PubMed
    1. Donlan RM, Costerton JW. Clin Microbiol Rev. 2002;15:167–193. - PMC - PubMed

Publication types