

GOFFA: gene ontology for functional analysis--a FDA gene ontology tool for analysis of genomic and proteomic data
- PMID: 17118145
- PMCID: PMC1683576
- DOI: 10.1186/1471-2105-7-S2-S23
GOFFA: gene ontology for functional analysis--a FDA gene ontology tool for analysis of genomic and proteomic data
Abstract
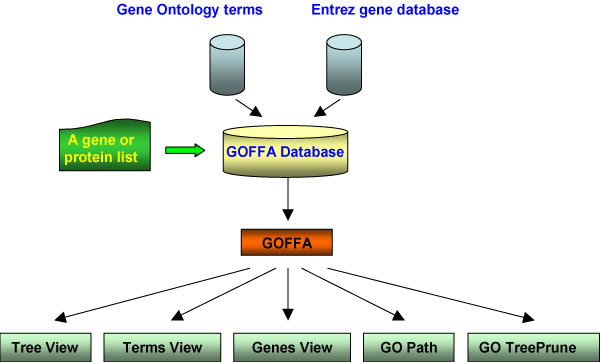
Background: Gene Ontology (GO) characterizes and categorizes the functions of genes and their products according to biological processes, molecular functions and cellular components, facilitating interpretation of data from high-throughput genomics and proteomics technologies. The most effective use of GO information is achieved when its rich and hierarchical complexity is retained and the information is distilled to the biological functions that are most germane to the phenomenon being investigated.
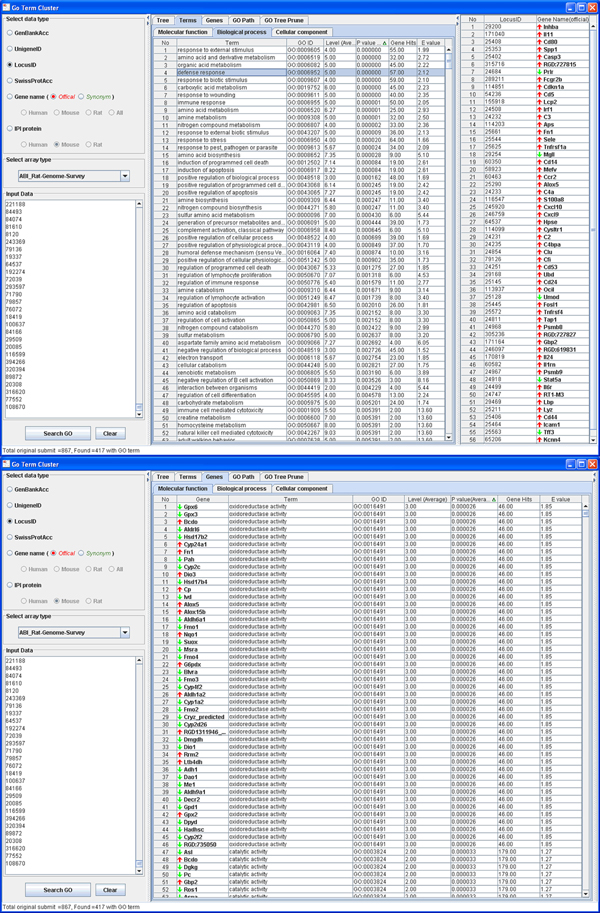
Results: Here we present a FDA GO tool named Gene Ontology for Functional Analysis (GOFFA). GOFFA first ranks GO terms in the order of prevalence for a list of selected genes or proteins, and then it allows the user to interactively select GO terms according to their significance and specific biological complexity within the hierarchical structure. GOFFA provides five interactive functions (Tree view, Terms View, Genes View, GO Path and GO TreePrune) to analyze the GO data. Among the five functions, GO Path and GO TreePrune are unique. The GO Path simultaneously displays the ranks that order GOFFA Tree Paths based on statistical analysis. The GO TreePrune provides a visual display of a reduced GO term set based on a user's statistical cut-offs. Therefore, the GOFFA visual display can provide an intuitive depiction of the most likely relevant biological functions.
Conclusion: With GOFFA, the user can dynamically interact with the GO data to interpret gene expression results in the context of biological plausibility, which can lead to new discoveries or identify new hypotheses.
Availability: GOFFA is available through ArrayTrack softwarehttp://edkb.fda.gov/webstart/arraytrack/.
Figures


Similar articles
-
GeneTools--application for functional annotation and statistical hypothesis testing.BMC Bioinformatics. 2006 Oct 24;7:470. doi: 10.1186/1471-2105-7-470. BMC Bioinformatics. 2006. PMID: 17062145 Free PMC article.
-
DynGO: a tool for visualizing and mining of Gene Ontology and its associations.BMC Bioinformatics. 2005 Aug 9;6:201. doi: 10.1186/1471-2105-6-201. BMC Bioinformatics. 2005. PMID: 16091147 Free PMC article.
-
Additional gene ontology structure for improved biological reasoning.Bioinformatics. 2006 Aug 15;22(16):2020-7. doi: 10.1093/bioinformatics/btl334. Epub 2006 Jun 20. Bioinformatics. 2006. PMID: 16787968
-
Functional genomics and proteomics in the clinical neurosciences: data mining and bioinformatics.Prog Brain Res. 2006;158:83-108. doi: 10.1016/S0079-6123(06)58004-5. Prog Brain Res. 2006. PMID: 17027692 Review.
-
[Transcriptomes for serial analysis of gene expression].J Soc Biol. 2002;196(4):303-7. J Soc Biol. 2002. PMID: 12645300 Review. French.
Cited by
-
Genomic differences distinguish the myofibroblast phenotype of distal lung fibroblasts from airway fibroblasts.Am J Respir Cell Mol Biol. 2011 Dec;45(6):1256-62. doi: 10.1165/rcmb.2011-0065OC. Epub 2011 Jul 14. Am J Respir Cell Mol Biol. 2011. PMID: 21757679 Free PMC article.
-
Dietary supplementation with long-chain monounsaturated fatty acid isomers decreases atherosclerosis and alters lipoprotein proteomes in LDLr-/- mice.Atherosclerosis. 2017 Jul;262:31-38. doi: 10.1016/j.atherosclerosis.2017.04.017. Epub 2017 Apr 25. Atherosclerosis. 2017. PMID: 28486149 Free PMC article.
-
Comparative systems biology of human and mouse as a tool to guide the modeling of human placental pathology.Mol Syst Biol. 2009;5:279. doi: 10.1038/msb.2009.37. Epub 2009 Jun 16. Mol Syst Biol. 2009. PMID: 19536202 Free PMC article.
-
ArrayTrack: a free FDA bioinformatics tool to support emerging biomedical research--an update.Hum Genomics. 2010 Aug;4(6):428-34. doi: 10.1186/1479-7364-4-6-428. Hum Genomics. 2010. PMID: 20846933 Free PMC article. Review.
-
Coordinated Action of Biological Processes during Embryogenesis Can Cause Genome-Wide Linkage Disequilibrium in the Human Genome and Influence Age-Related Phenotypes.Ann Gerontol Geriatr Res. 2016;3(1):1035. Epub 2016 May 4. Ann Gerontol Geriatr Res. 2016. PMID: 28357417 Free PMC article.
References
-
- Tong W, Harris S, Cao X, Fang H, Shi L, Sun H, Fuscoe J, Harris A, Hong H, Xie Q, et al. Development of public toxicogenomics software for microarray data management and analysis. Mutat Res. 2004;549:241–253. - PubMed
MeSH terms
LinkOut - more resources
Full Text Sources
